BYD Stock (1211.HK): Revenue, Margins, Valuation 2026
BYD (HKEX: 1211, Shenzhen: 002594) closed at HK$69.20 on Nov 11, 2026, down 27.4% this year, while revenue for the September 2026 quarter grew 13.6% year on year to RMB 221.5 bn, the first rise after four straight declines. This is a data page, not a recommendation.
BYD stock price and key numbers (1211.HK)
BYD's Hong Kong shares closed at HK$69.20 on Nov 11, 2026, a market cap of about HK$775 bn and down 27.4% so far this year. Q3 FY2026 revenue was RMB 221.5 bn (+13.6% year on year) at an 18.0% gross margin.
| What | Figure | As of | Read |
|---|---|---|---|
| Share price (H) | HK$69.20 | Nov 11, 2026 close | −3.8% on the day; 39.0% below the 52-week high of HK$113.40 (Apr 16, 2026) |
| Market cap | ≈ HK$775 bn | Nov 11, 2026 | Trailing P/E 17.3x, P/B 2.2x, P/S 0.7x, dividend yield 0.6% |
| Year-to-date move | −27.4% | Nov 11, 2026 close vs Dec 31, 2025 close (HK$95.35) | 1-year move −31.7%; 52-week low HK$67.00 (Oct 30, 2026) |
| Latest quarter revenue (Q3 FY2026) | RMB 221.5 bn | Reported, quarter to Sep 30, 2026 | +13.6% year on year, the first rise after four declines |
| Latest quarter gross margin | 18.0% | Reported | 0.9 points below Q2 FY2026 (18.9%) |
Source: Winus (winus.ai) financial data (official data aggregated from global exchanges and trading partners), retrieved Nov 12, 2026 (HKT). Price, valuation and 52-week range are market-data fields for 1211.HK; revenue, margin and profit are BYD's reported group figures, which are the same for the Hong Kong and Shenzhen listings. Reporting currency RMB; share price HK$. Company site: BYD. The Shenzhen line closed at RMB 82.04 the same day.
The rows split into a falling price and a recovering income statement. The Hong Kong shares are 27.4% lower this year and 3.3% above their 52-week low, while revenue and net profit both grew more than 13% year on year in the latest quarter.
BYD revenue, gross margin and net profit by quarter
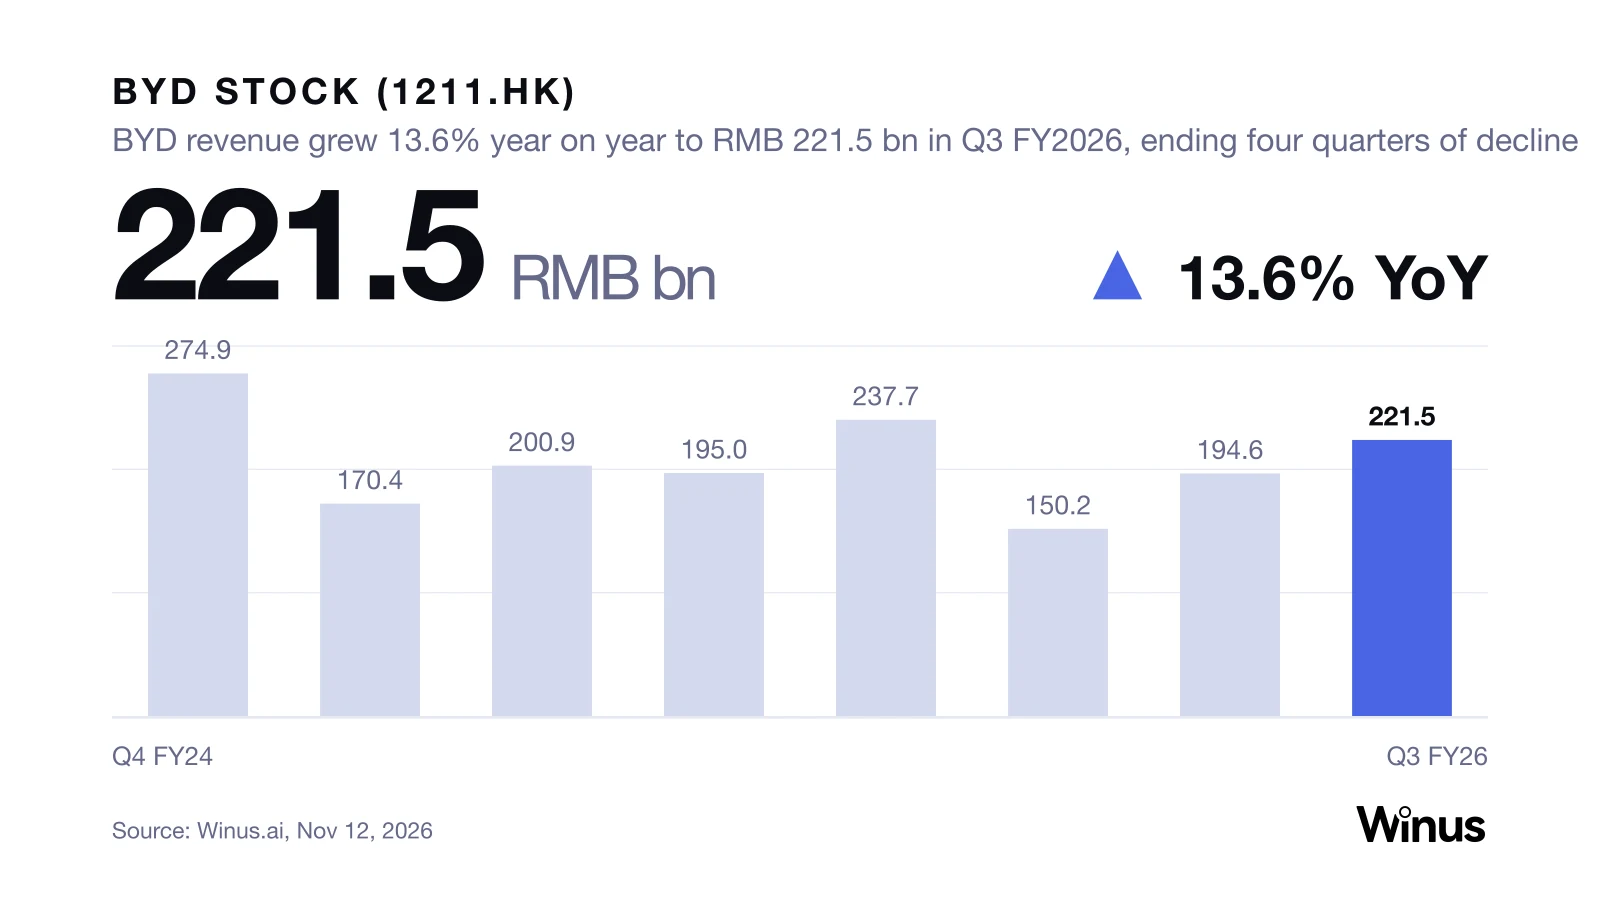
BYD's revenue rose 13.6% year on year to RMB 221.5 bn in Q3 FY2026, ending four straight quarterly declines, while net profit grew 28.1% to RMB 10.0 bn at an 18.0% gross margin.
BYD's fiscal year is the calendar year, so Q3 FY2026 is July to September 2026. Revenue and net profit are in RMB billions. Net profit is profit attributable to shareholders of the parent.
Show data
| Period | RMB bn | Note |
|---|---|---|
| Q4 FY24 | 274.9 | |
| Q1 FY25 | 170.4 | |
| Q2 FY25 | 200.9 | |
| Q3 FY25 | 195.0 | |
| Q4 FY25 | 237.7 | −13.5% YoY |
| Q1 FY26 | 150.2 | −11.8% YoY |
| Q2 FY26 | 194.6 | −3.2% YoY |
| Q3 FY26 | 221.5 | +13.6% YoY |
Source: Winus (winus.ai) financial data, retrieved Nov 12, 2026 (HKT); BYD reported figures
| Quarter | Revenue (RMB bn) | Revenue YoY | Gross margin | Net profit (RMB bn) | Net profit YoY |
|---|---|---|---|---|---|
| Q4 FY2024 | 274.9 | +52.7% | 17.0% | 15.0 | +73.1% |
| Q1 FY2025 | 170.4 | +36.3% | 20.1% | 9.2 | +100.4% |
| Q2 FY2025 | 200.9 | +14.0% | 16.3% | 6.4 | −29.9% |
| Q3 FY2025 | 195.0 | −3.1% | 17.6% | 7.8 | −32.6% |
| Q4 FY2025 | 237.7 | −13.5% | 17.4% | 9.3 | −38.2% |
| Q1 FY2026 | 150.2 | −11.8% | 18.8% | 4.1 | −55.4% |
| Q2 FY2026 | 194.6 | −3.2% | 18.9% | 8.2 | +29.7% |
| Q3 FY2026 | 221.5 | +13.6% | 18.0% | 10.0 | +28.1% |
Year-on-year figures from Q1 FY2025 on are computed from the quarters retrieved for this page; the Q4 FY2024 row is the data feed's own year-on-year field, because the FY2023 quarters are not on this page. The quarterly figures are BYD's group results as carried on the Shenzhen line.
Three things the table says on its own:
- Revenue turned in Q3 FY2026. Four quarters of decline (−3.1%, −13.5%, −11.8%, −3.2%) were followed by +13.6%. Revenue was also up 13.8% on the previous quarter (RMB 194.6 bn).
- Gross margin is 0.4 points above a year ago. Q3 FY2026's 18.0% compares with 17.6% in Q3 FY2025. The eight-quarter range is 16.3% to 20.1%, and the last three quarters were 18.8%, 18.9% and 18.0%.
- Net profit is the highest since Q4 FY2024. RMB 10.0 bn is the best quarter in the table after RMB 15.0 bn in Q4 FY2024. Q4 has been the largest revenue quarter in both years of the window (RMB 274.9 bn and RMB 237.7 bn).
Gross profit grew faster than revenue. Q3 FY2026 gross profit was RMB 39.9 bn, 16.1% above the RMB 34.3 bn of Q3 FY2025, against revenue growth of 13.6%, because gross margin was 0.4 points higher. Net profit was 4.5% of revenue in the quarter. Gross profit is computed as revenue times gross margin from the quarters above.
Show data
| Period | % | Note |
|---|---|---|
| Q4 FY24 | 17.0 | |
| Q1 FY25 | 20.1 | Eight-quarter high |
| Q2 FY25 | 16.3 | Eight-quarter low |
| Q3 FY25 | 17.6 | |
| Q4 FY25 | 17.4 | |
| Q1 FY26 | 18.8 | |
| Q2 FY26 | 18.9 | |
| Q3 FY26 | 18.0 | 18.0% |
Source: Winus (winus.ai) financial data, retrieved Nov 12, 2026 (HKT); BYD reported figures
Show data
| Period | RMB bn | Note |
|---|---|---|
| Q4 FY24 | 15.0 | Peak quarter |
| Q1 FY25 | 9.2 | |
| Q2 FY25 | 6.4 | |
| Q3 FY25 | 7.8 | |
| Q4 FY25 | 9.3 | |
| Q1 FY26 | 4.1 | −55.4% YoY |
| Q2 FY26 | 8.2 | |
| Q3 FY26 | 10.0 | +28.1% YoY |
Source: Winus (winus.ai) financial data, retrieved Nov 12, 2026 (HKT); profit attributable to shareholders
BYD annual revenue and net profit by year
BYD's FY2025 revenue was RMB 804.0 bn, up 3.5% from RMB 777.1 bn in FY2024, while net profit fell 19.0% to RMB 32.6 bn.
| FY2024 | FY2025 | Change | |
|---|---|---|---|
| Revenue (RMB bn) | 777.1 | 804.0 | +3.5% |
| Gross margin | 19.4% | 17.7% | −1.7 pts |
| Net profit (RMB bn) | 40.3 | 32.6 | −19.0% |
Annual figures are the sum of four reported quarters; gross margin is the revenue-weighted average of those quarters, and the change is computed from unrounded values. The first nine months of FY2026 compare with the same period of FY2025 like this:
| 9M FY2025 | 9M FY2026 | Change | |
|---|---|---|---|
| Revenue (RMB bn) | 566.3 | 566.3 | +0.0% |
| Gross margin | 17.9% | 18.5% | +0.6 pts |
| Net profit (RMB bn) | 23.3 | 22.3 | −4.2% |
Revenue is level, margin is higher and profit is 4.2% lower. The last four reported quarters (Q4 FY2025 to Q3 FY2026) carry RMB 31.6 bn of net profit, 3.0% below FY2025's RMB 32.6 bn. Segment data (vehicles, batteries, electronics) is not on this page; see BYD's results announcements.
What is the difference between BYD's H-share, A-share and ADR?
BYD's H-share trades in Hong Kong as 1211.HK (HK$69.20 on Nov 11, 2026), its A-share trades in Shenzhen as 002594.SZ (RMB 82.04), and an over-the-counter ADR trades in the US as BYDDY (US$8.72).
| Listing | Ticker | Currency | Close, Nov 11, 2026 | Trailing P/E | Note |
|---|---|---|---|---|---|
| Hong Kong Main Board (H-share) | 1211.HK | HKD | 69.20 | 17.3x | Listed Jul 31, 2002 (Winus data) |
| Shenzhen Stock Exchange (A-share) | 002594.SZ | RMB | 82.04 | 23.6x | Listed Jun 30, 2011 |
| US over-the-counter ADR | BYDDY | USD | 8.72 | Over the counter | |
| US over-the-counter ordinary share | BYDDF | USD | 8.79 | OTC Pink |
All lines are the same company, so revenue and profit are the same RMB figures above. The two main lines trade at different multiples: the Shenzhen line is at 23.6x trailing earnings and 3.0x book, the Hong Kong line at 17.3x and 2.2x. The prices are in different currencies and this page does not convert them. The number of shares behind each ADR is not on this page (see BYD's investor relations materials), so the ADR price cannot be compared one for one.
How much of BYD do southbound investors hold?
Mainland Chinese investors held 355,332,717 BYD H-shares through Stock Connect on Nov 11, 2026, which is 9.64% of the shares according to Winus financial data.
| Value | As of | |
|---|---|---|
| Southbound (Stock Connect) holding, shares | 355,332,717 | Nov 11, 2026 |
| Southbound holding, share of company | 9.64% | Nov 11, 2026 |
This page does not carry the local analyst consensus or the Wall Street consensus for BYD; the Winus company one-pager skill can add them (see below).
What is BYD's P/E ratio and 52-week range?
BYD's Hong Kong line trades at 17.3 times trailing earnings and 2.2 times book at the HK$69.20 close, with a 52-week range of HK$67.00 to HK$113.40 (Nov 12, 2025 to Nov 11, 2026).
| Metric | Hong Kong line (1211.HK) | Shenzhen line (002594.SZ) |
|---|---|---|
| Close, Nov 11, 2026 | HK$69.20 | RMB 82.04 |
| Trailing P/E | 17.3x | 23.6x |
| P/B | 2.2x | 3.0x |
| P/S | 0.7x | 0.9x |
| Dividend yield | 0.6% | 0.4% |
| Year-to-date move | −27.4% | −16.0% |
| 52-week range | HK$67.00 – HK$113.40 | RMB 77.60 – RMB 111.82 |
| Market cap | ≈ HK$775 bn | ≈ RMB 664 bn |
Recent closes show the path. The Hong Kong line closed at HK$72.30 on Nov 4, rose 4.7% to HK$75.70 on Nov 5 and fell on each of the next four sessions:
| Session | Hong Kong close (HK$) | Day change |
|---|---|---|
| Nov 4, 2026 | 72.30 | −0.1% |
| Nov 5, 2026 | 75.70 | +4.7% |
| Nov 6, 2026 | 74.15 | −2.0% |
| Nov 9, 2026 | 72.45 | −2.3% |
| Nov 10, 2026 | 71.95 | −0.7% |
| Nov 11, 2026 | 69.20 | −3.8% |
The 52-week ranges use intraday highs and lows from daily price bars. The Hong Kong price is 3.3% above its low (Oct 30, 2026) and 39.0% below its high (Apr 16, 2026). The Shenzhen price is 5.7% above its low (Jun 29, 2026) and 26.6% below its high (Mar 23, 2026). The Hong Kong line fell 3.8% on Nov 11, 2026 and the Shenzhen line fell 2.8%. Market cap is each line's own data field and the two should not be added.
The trailing P/E rests on RMB 31.6 bn of net profit. With Q4 FY2025's RMB 9.3 bn rolling off at the next report, a Q4 FY2026 profit above that figure lowers the trailing multiple at a constant price, and a lower figure raises it. That is arithmetic, not a forecast.
BYD earnings: what to watch in the Q4 FY2026 results
Three numbers decide how the Q4 FY2026 report reads: revenue against RMB 237.7 bn, gross margin against 17.4%, and net profit against RMB 9.3 bn, all from Q4 FY2025.
The next report that adds a quarter to this table covers Q4 FY2026 (October to December 2026) and comes with BYD's full-year results. BYD announces the date on its investor relations site, and the date is not in our data. The three comparisons:
| Check | Benchmark | Why it matters |
|---|---|---|
| Revenue | RMB 237.7 bn (Q4 FY2025) and +13.6% (Q3 FY2026) | Q4 revenue of RMB 237.7 bn would put FY2026 level with FY2025's RMB 804.0 bn, after RMB 566.3 bn in nine months |
| Gross margin | 17.4% (Q4 FY2025) and 18.0% (Q3 FY2026) | Whether the margin holds above the year-ago level for a third quarter |
| Net profit | RMB 9.3 bn (Q4 FY2025) and RMB 10.0 bn (Q3 FY2026) | Q4 FY2025 was down 38.2% on the year, so its base is well below Q4 FY2024's RMB 15.0 bn |
How to check BYD's numbers yourself in Winus
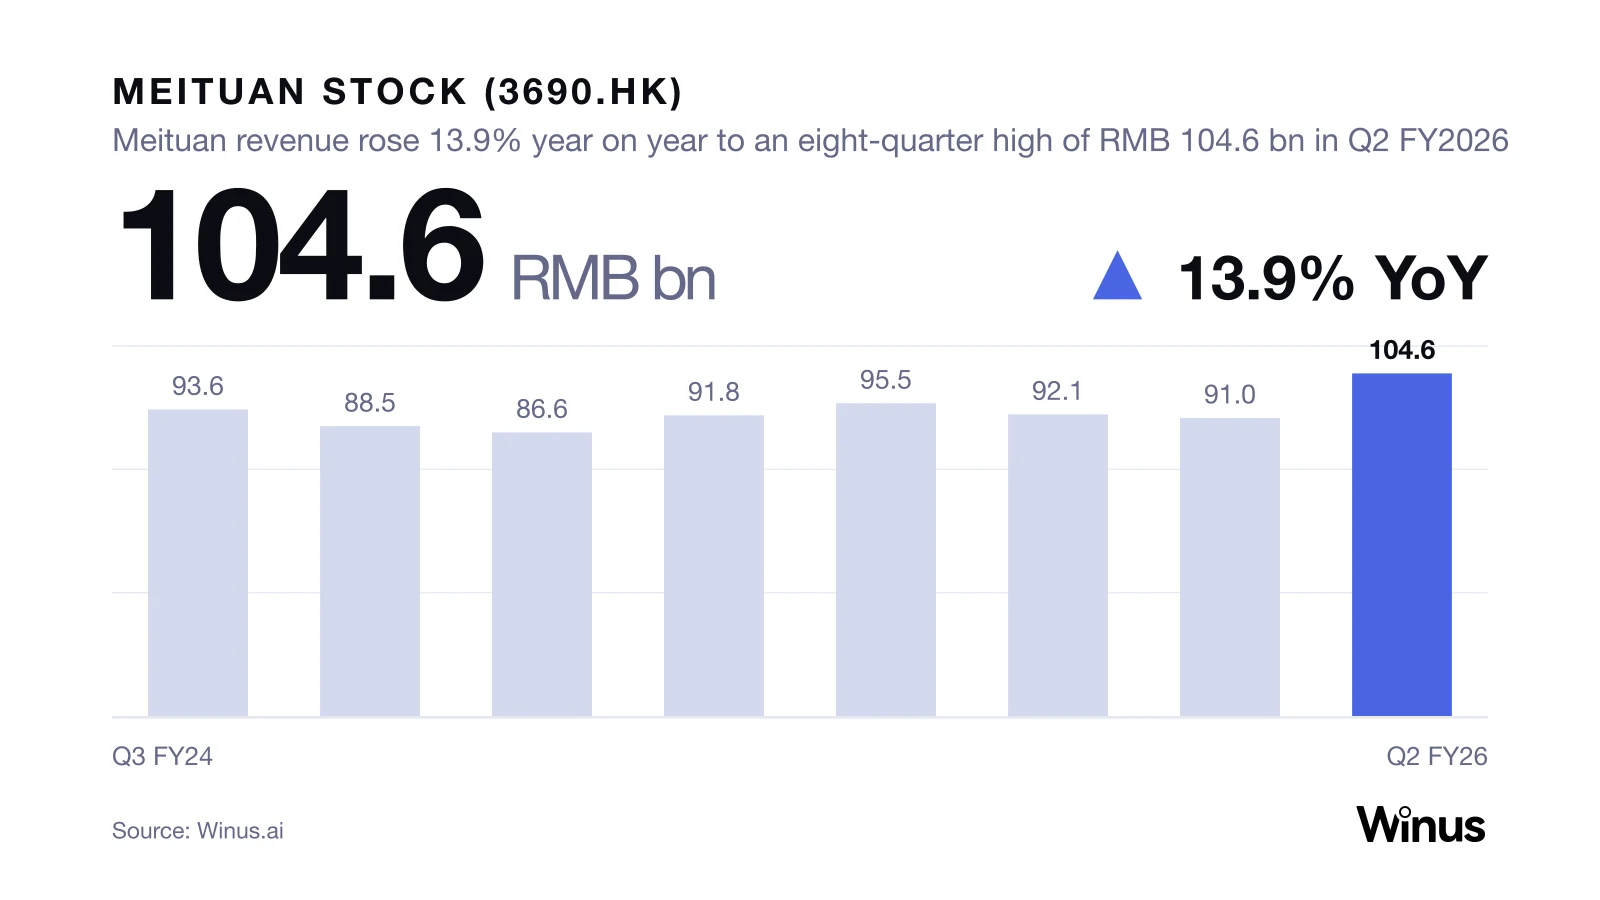
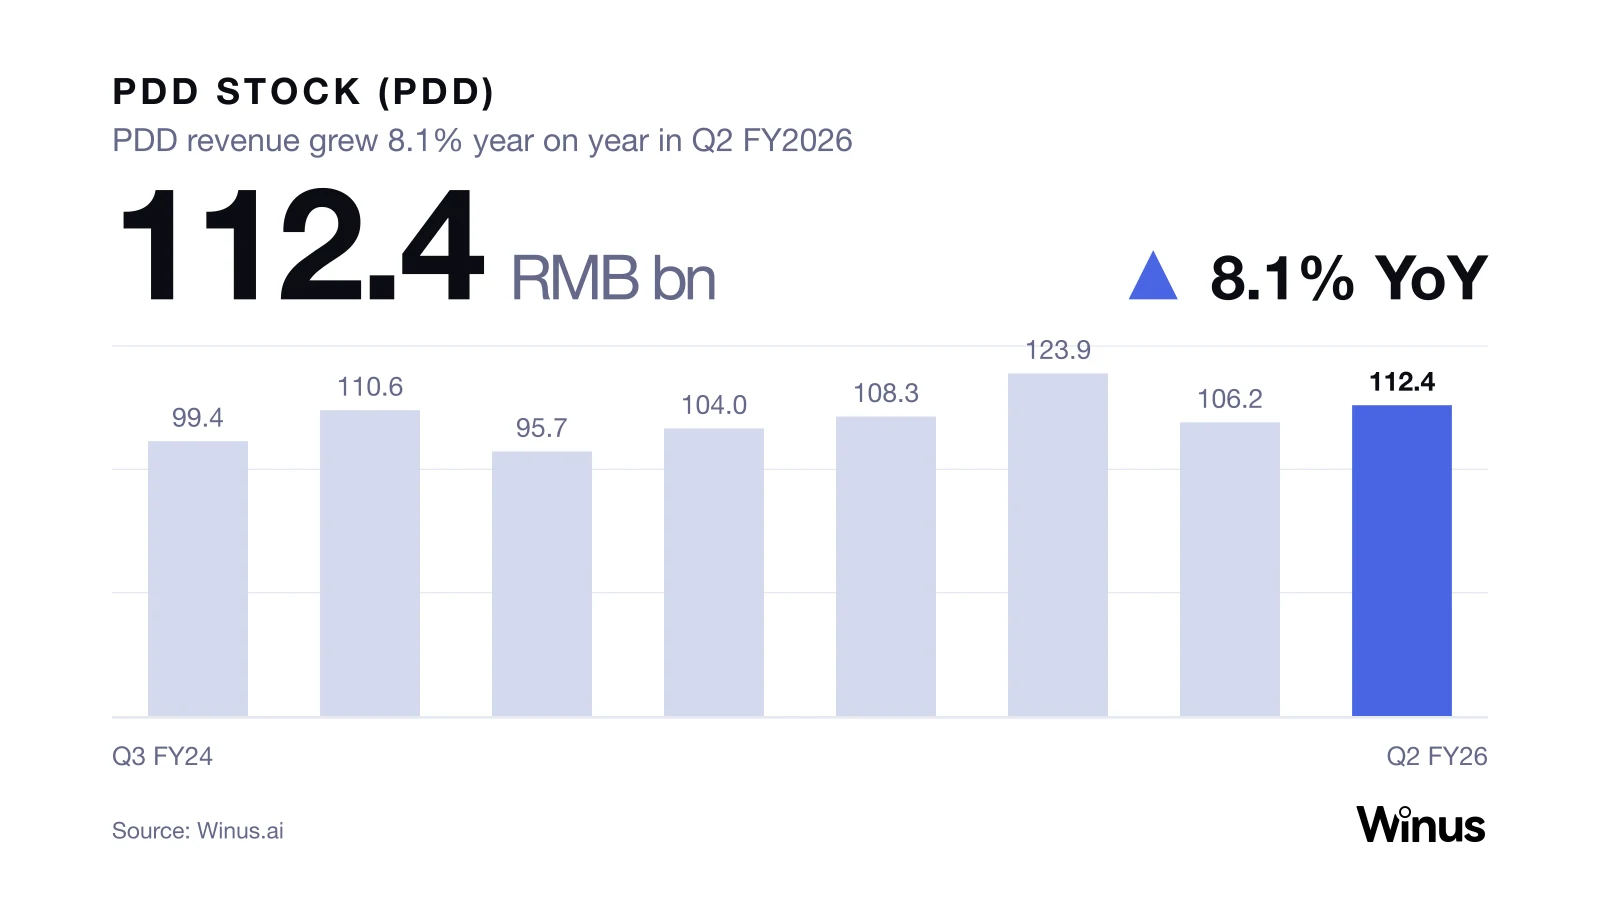
Open Financial Chat, type #1211.HK, and ask for the same eight-quarter table with the Q4 FY2026 figures added the day they are filed. The company one-pager skill can add the segment split, the A-share versus H-share comparison over time and the analyst consensus that this page does not carry. For the same layout on another Chinese manufacturing name, see CATL stock or Xiaomi stock.

Open 1211.HK in WinusFree tier: new accounts start with 1,000 credits at sign-up.
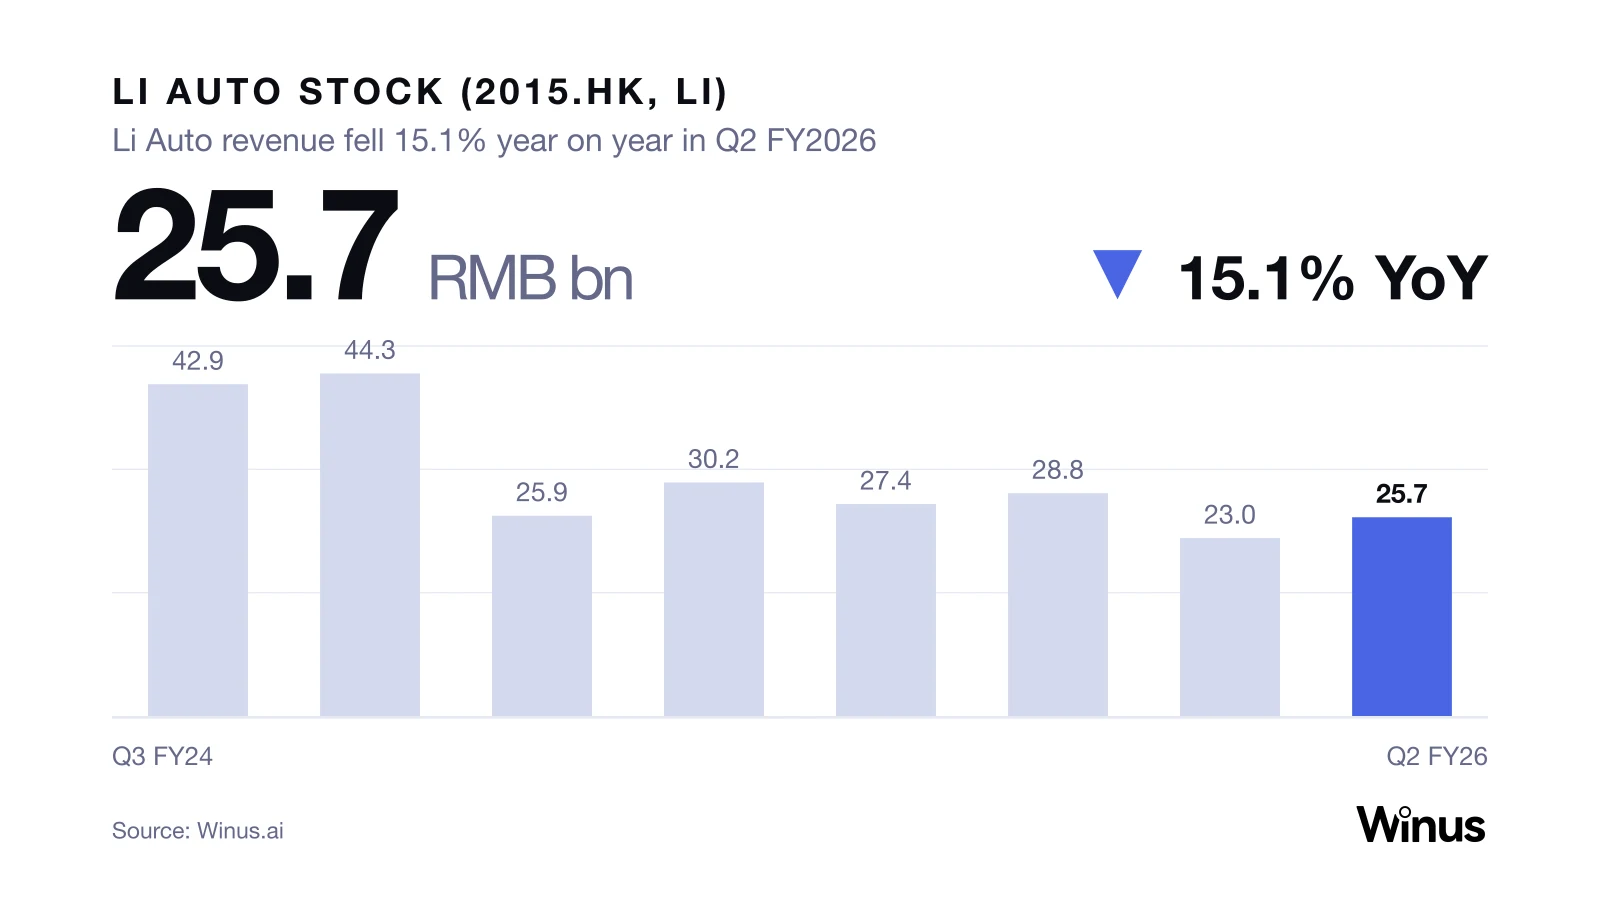
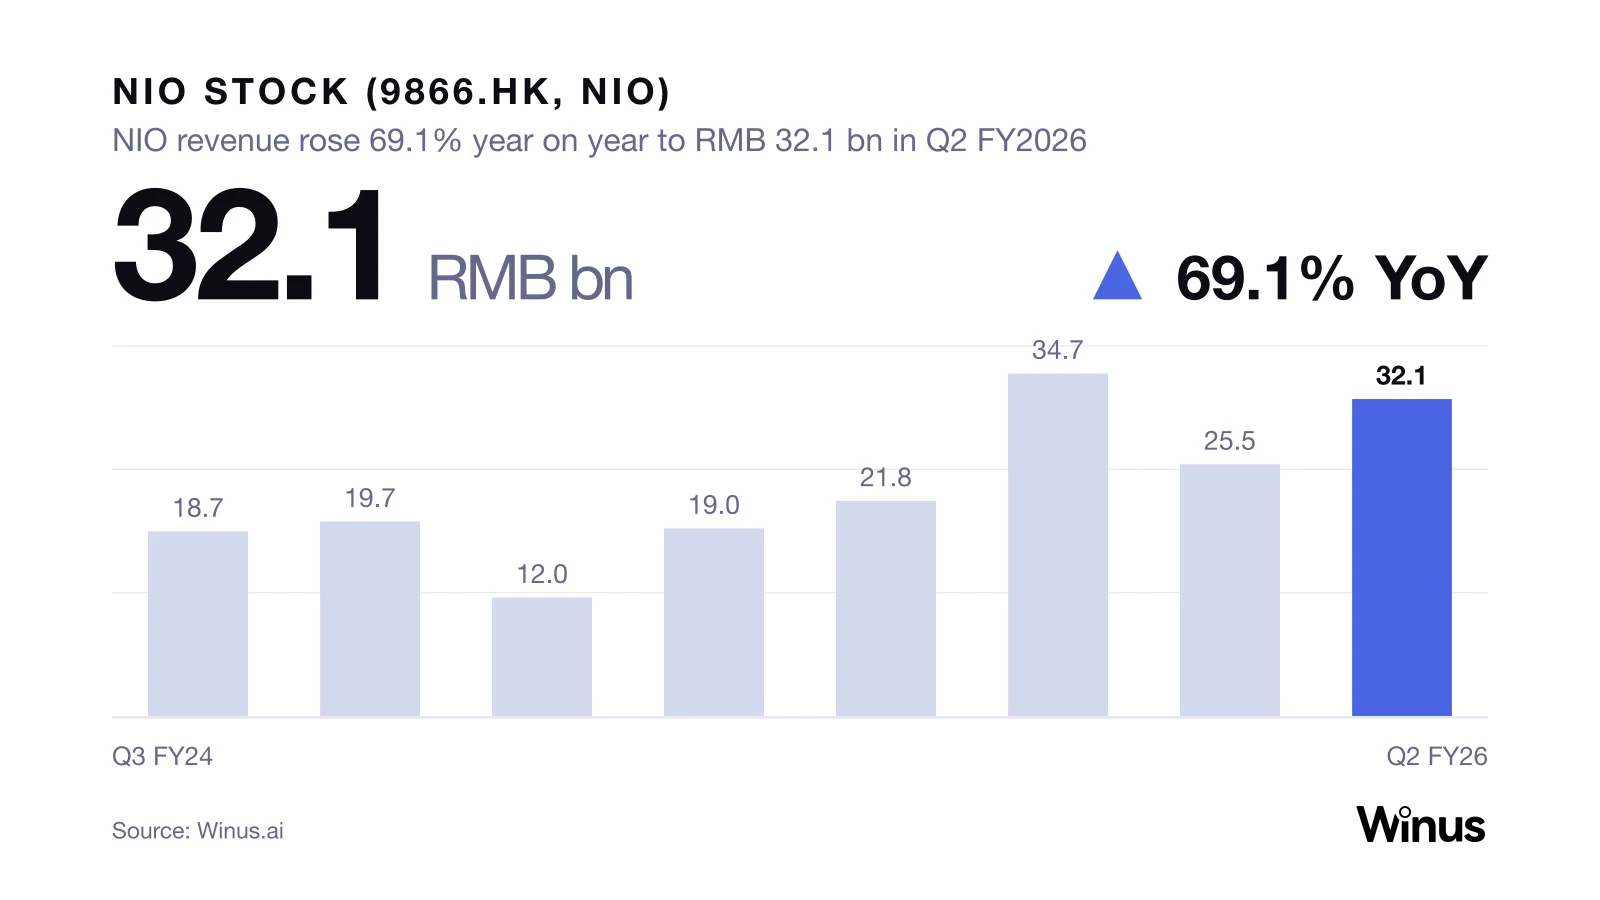
Related reading: XPeng Stock, Li Auto Stock, NIO Stock.
About Winus. Winus (winus.ai) is a financial AI agent platform built on professional financial data and research expertise. Answers carry built-in citations, reusable skills run research workflows, and the output can be a report, an Excel model or a deck. To follow BYD's next report against the benchmarks on this page, Winus can run an earnings analysis for any company and return a note you can keep.
Data sourced from Winus (winus.ai) financial data, which aggregates official data from global exchanges and trading partners. Figures as retrieved on Nov 12, 2026 (HKT); BYD's own filings govern if they differ. This page is for information only and is not investment advice.
FAQ
Is BYD stock listed in the US?
BYD's primary listings are in Hong Kong (1211.HK) and Shenzhen (002594.SZ). In the US, Winus data shows an over-the-counter ADR, BYDDY, which closed at US$8.72 on Nov 11, 2026. This page uses the Hong Kong line for price and valuation.
What is the difference between BYD's H-share and A-share price?
The H-share (1211.HK) closed at HK$69.20 and the A-share (002594.SZ) at RMB 82.04 on Nov 11, 2026, in different currencies. On trailing earnings the H-share trades at 17.3x and the A-share at 23.6x.
When does BYD report earnings?
BYD announces each results date on its investor relations site, and that date is not in the data used for this page. BYD has reported Q3 FY2026 (July to September 2026); the next quarter to be added is Q4 FY2026, benchmarked above.
What currency are BYD's revenue and profit reported in?
Renminbi. BYD reports in RMB, so the quarterly and annual tables are RMB billions. The Hong Kong share price, market cap and 52-week range are in Hong Kong dollars; the Shenzhen price is in RMB.
What is Winus?
Winus is a financial AI agent platform built on professional financial data and research expertise. It combines specialized tools, reusable financial skills and coordinated AI agents so a natural-language request about a company, fund or market can produce research reports, Excel models and presentation decks. Type #1211.HK in Winus to run this page's analysis yourself.