Top 10 A-Share IPO First-Day Gains in 2025
Top 10 A-share IPOs in 2025: First-Day Gains by Sector
Data Scope & Key Facts (as of January 9, 2026)
The analysis covers the top 10 A-share IPOs in 2025, ranked by their first-day gains (percentage change from IPO price to first close). Each IPO is classified by sector using the WIND Industry standard. The dataset includes company names, stock codes, IPO dates, sector classifications, and first-day gain percentages.
Summary Table: Top 10 IPOs by First-Day Gains (2025)
| Rank | Company (Short Name) | Stock Code | IPO Date | Sector (WIND) | First-Day Gain (%) |
|---|---|---|---|---|---|
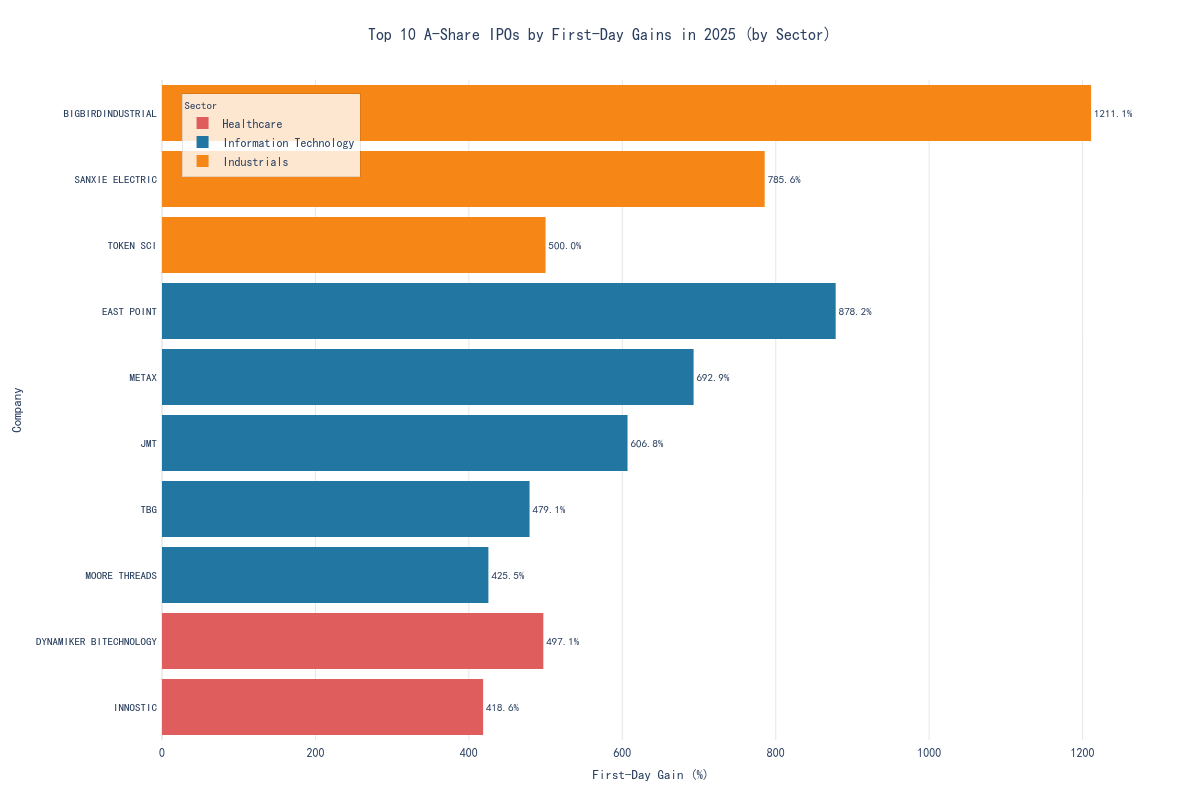
| 1 | BIGBIRDINDUSTRIAL | 920091.BJ | 2025-11-21 | Industrials | 1211.11 |
| 2 | EAST POINT | 920045.BJ | 2025-12-31 | Information Technology | 878.16 |
| 3 | SANXIE ELECTRIC | 920100.BJ | 2025-09-08 | Industrials | 785.62 |
| 4 | METAX | 688802.SH | 2025-12-17 | Information Technology | 692.95 |
| 5 | JMT | 603124.SH | 2025-03-20 | Information Technology | 606.83 |
| 6 | TOKEN SCI | 920037.BJ | 2025-06-26 | Industrials | 500.00 |
| 7 | DYNAMIKER BITECHNOLOGY | 920009.BJ | 2025-11-03 | Healthcare | 497.08 |
| 8 | TBG | 920005.BJ | 2025-07-31 | Information Technology | 479.12 |
| 9 | MOORE THREADS | 688795.SH | 2025-12-05 | Information Technology | 425.46 |
| 10 | INNOSTIC | 301584.SZ | 2025-09-25 | Healthcare | 418.58 |
Sector Distribution:
- Information Technology: 5 companies
- Industrials: 3 companies
- Healthcare: 2 companies
Sector-Wise Visualization
1. Horizontal Bar Chart: Top 10 IPOs by First-Day Gain (Color-Coded by Sector)
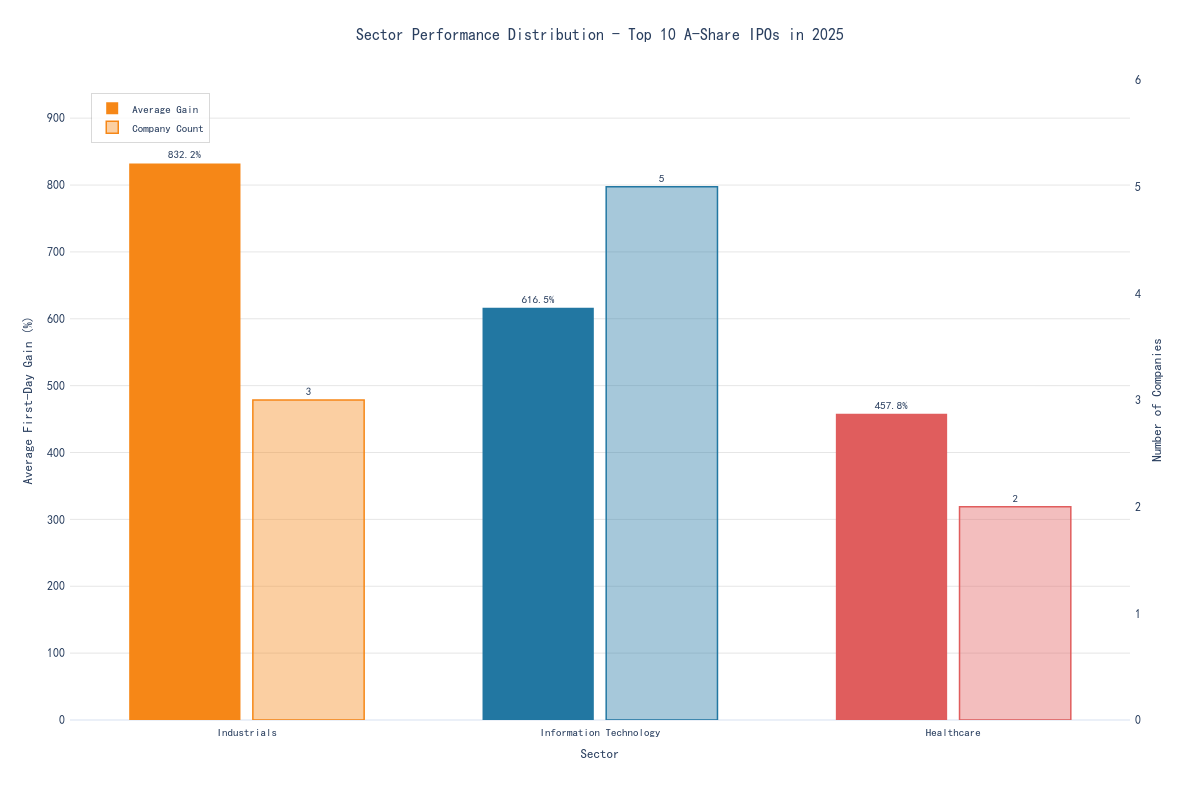
2. Grouped Bar Chart: Sector Performance Distribution
- Left axis: Average first-day gain (%) per sector
- Right axis: Number of companies per sector
Sector Performance Interpretation
The Industrials sector, despite having only three companies in the top 10, achieved the highest average first-day gain (832.24%), led by BIGBIRDINDUSTRIAL's exceptional 1211.11% surge. Information Technology dominated in terms of representation (five companies), but its average first-day gain (576.30%) was moderate compared to Industrials. Healthcare, with two companies, posted the lowest average first-day gain (457.83%) among the three sectors. This pattern suggests that, in 2025, investor enthusiasm for select industrial IPOs was particularly strong, possibly reflecting rotation into capital goods or machinery themes, while the broader tech sector maintained robust but less extreme debut performance.
Actionable Watchpoints
- If Industrials continue to deliver outsized IPO gains, monitor for potential sector rotation or policy-driven tailwinds in capital goods.
- Sustained high representation of Information Technology in top IPOs may indicate persistent investor appetite for tech growth stories.
- Watch for any reversal in Healthcare IPO performance, as lower average gains could signal sector-specific headwinds or valuation fatigue.
- Validate whether these first-day gains translate into sustained post-IPO performance or are primarily driven by short-term sentiment.
Downside Risks & Falsification
- If subsequent IPOs in Industrials or Information Technology sectors fail to attract similar first-day enthusiasm, it would challenge the thesis of sector leadership.
- A sharp reversal in overall IPO market sentiment (e.g., due to regulatory tightening or liquidity withdrawal) could invalidate the observed patterns.
- If post-IPO performance diverges significantly from first-day gains, it would suggest that initial returns are not reliable indicators of medium-term sector strength.
If you would like a deeper breakdown by subsector or a time series of IPO performance, I can prepare additional visualizations or tables.