Recession Indicators: Yield Curve, Jobs, Claims (Nov 2026)
On Nov 10, 2026 the 10-year Treasury yield was 0.25 points above the 2-year (4.98% vs 4.73%), unemployment was 4.1% in October, and initial jobless claims were 189,000, equal to their 52-week low. Of the three indicators that come with a trigger rule, none is triggered. This is a data page, not a recommendation.
What are the main recession indicators, and what do they show now?
Eight US indicators are tracked here, and the three that come with a trigger rule (the yield curve, the Sahm rule and two negative GDP quarters) have not reached their triggers as of Nov 10, 2026.
| Indicator | Latest | Date | How it is read | Source |
|---|---|---|---|---|
| Yield curve, 10-year minus 2-year | +0.25 points | Nov 10, 2026 | Below zero means inverted | US Department of the Treasury |
| Yield curve, 10-year minus 3-month | +0.68 points | Nov 10, 2026 | Below zero means inverted | US Department of the Treasury |
| Unemployment rate | 4.1% | Oct 2026 | Compare with its own recent low | Bureau of Labor Statistics |
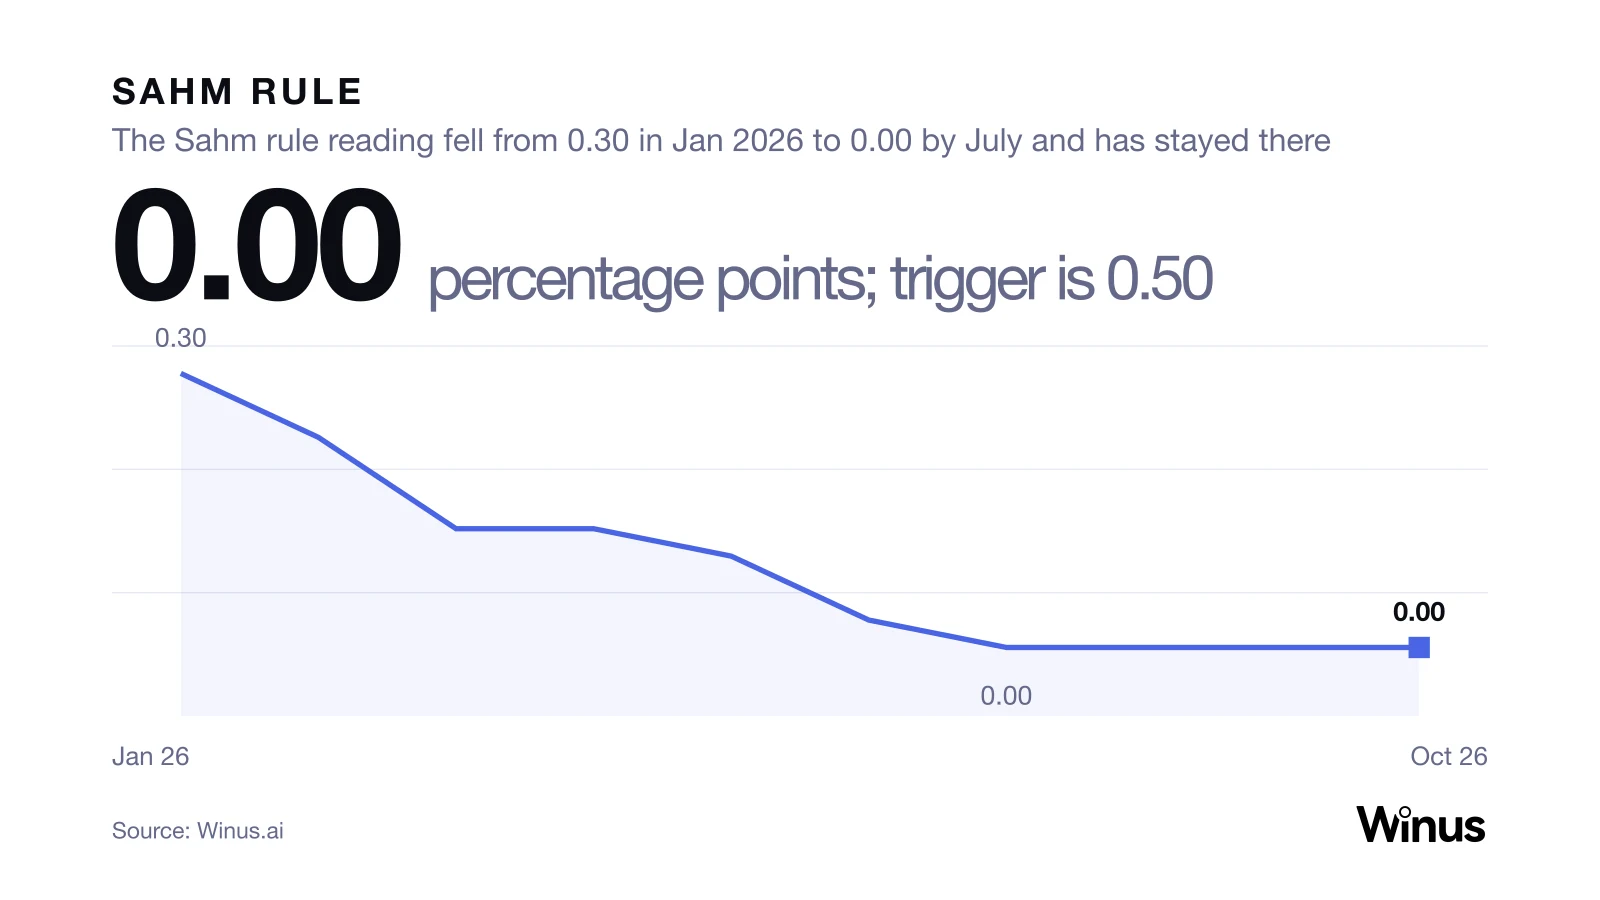
| Sahm rule reading | 0.00 points | Oct 2026 | Trigger at 0.50 or more | Calculated from BLS data |
| Nonfarm payrolls, monthly change | +165,000 | Oct 2026 | Negative means jobs lost | Bureau of Labor Statistics |
| Initial jobless claims | 189,000 | Week ended Oct 31, 2026 | Compare with 52-week range (189,000 to 237,000) | US Department of Labor |
| Consumer sentiment (University of Michigan) | 48.0 | Oct 2026 | Compare with its own range | University of Michigan Surveys of Consumers |
| Real GDP growth, annualized | +3.4% | Q3 2026 | Two negative quarters in a row is the common rule of thumb | Bureau of Economic Analysis |
Source: Winus (winus.ai) financial data (US Treasury, BLS, US Department of Labor, University of Michigan, BEA), retrieved Nov 12, 2026 (HKT). The latest Treasury yields are for Nov 10, 2026. The Sahm reading is calculated on this page from the BLS unemployment series.
Only some of these come with a trigger rule. The curve has one (below zero), the Sahm rule has one (0.50) and GDP has a widely used rule of thumb (two negative quarters in a row). Payrolls, claims, unemployment and sentiment have no agreed threshold, so the sections below show each against its own recent range and say so. Not on this page: the ISM manufacturing PMI and any composite leading index.
Is the yield curve inverted? The 10-year minus 2-year spread
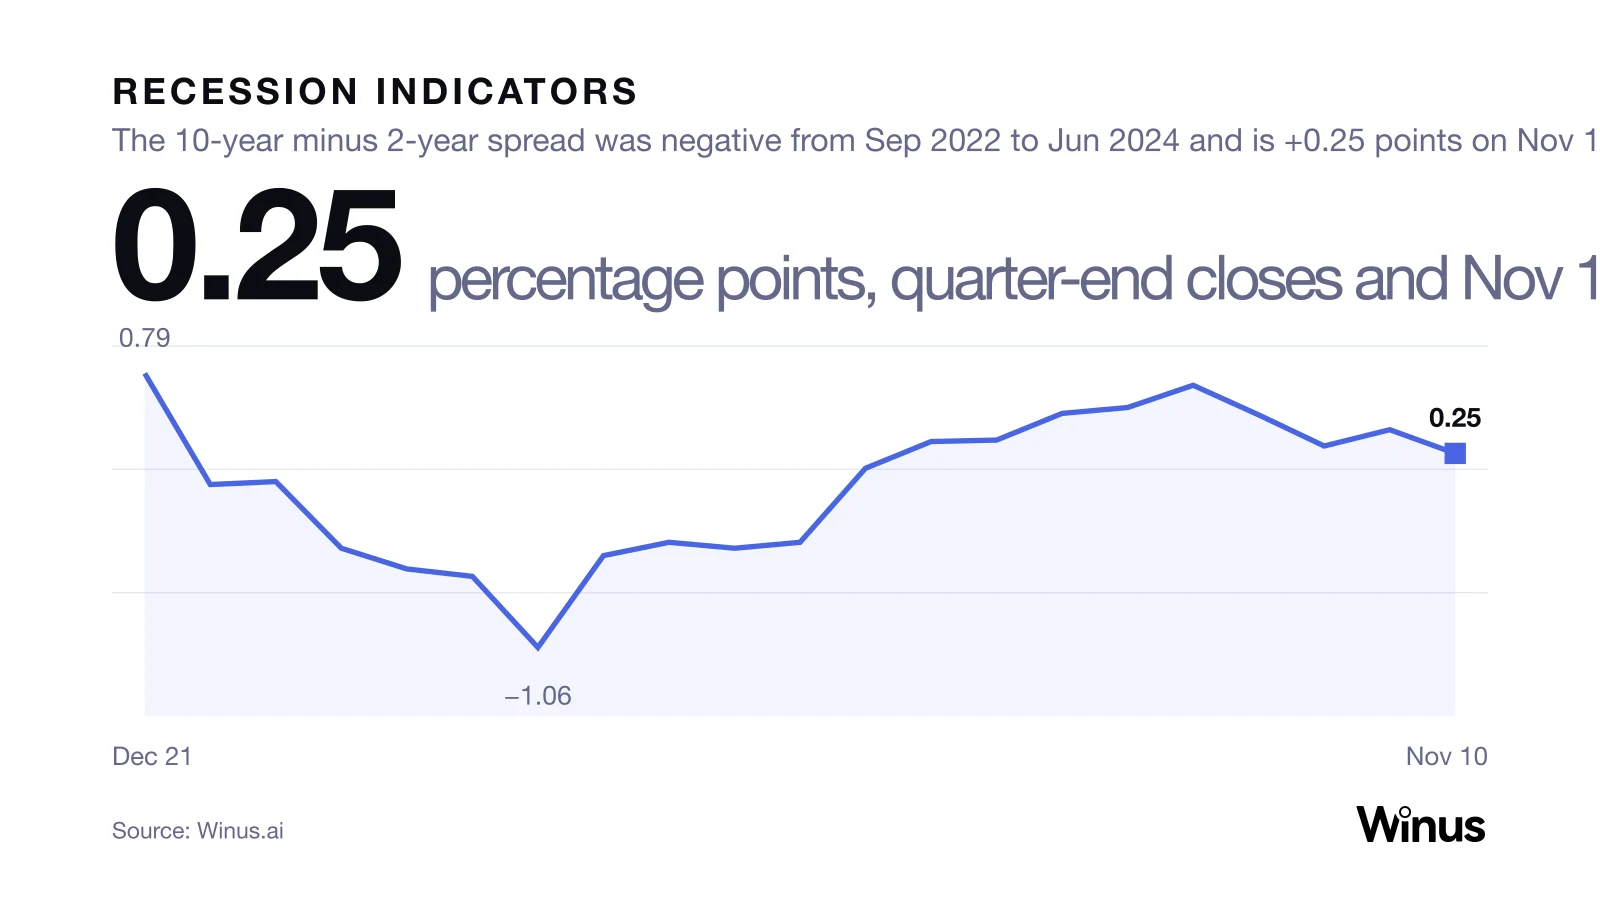
The yield curve is not inverted: on Nov 10, 2026 the 10-year Treasury yield was 4.98% and the 2-year 4.73%, a spread of +0.25 points, and the last close below zero was Sep 5, 2024.
| Measure | Latest (Nov 10, 2026) | Last close below zero | Main inversion | Deepest close |
|---|---|---|---|---|
| 10-year minus 2-year | +0.25 points | Sep 5, 2024 (-0.02) | Jul 6, 2022 to Aug 26, 2024 | -1.08 (Jul 3, 2023) |
| 10-year minus 3-month | +0.68 points | Oct 16, 2025 (-0.03) | Oct 25, 2022 to Dec 12, 2024 | -1.89 (May 4, 2023) |
Source: Winus (winus.ai) financial data (US Department of the Treasury, daily closes), retrieved Nov 12, 2026 (HKT). Calculated from closes between Nov 10, 2021 and Nov 10, 2026. The 3-month yield was 4.30% on Nov 10; the 10-year minus 3-month spread also closed below zero on scattered days between Feb 26 and Oct 16, 2025.
The rule is simple: when the 10-year yield falls below a shorter-dated yield, the curve is inverted, and the traditional reading is that markets expect lower rates and weaker growth ahead. The lead time between an inversion and a downturn varies and is not measured on this page. What the data shows for the latest cycle: the 10-year minus 2-year spread closed below zero on 541 days in the five years to Nov 10, 2026, spent two years in the main inversion, and has been positive on every close since Sep 5, 2024. The spread was +0.32 on Nov 9 and fell to +0.25 on Nov 10, when the 2-year rose 17 basis points and the 10-year 10 basis points, the narrowest close since Sep 22, 2026, when it was also +0.25.
Show data
| Period | percentage points, quarter-end closes and Nov 10, 2026 | Note |
|---|---|---|
| Dec 21 | 0.79 | |
| Mar 22 | 0.04 | |
| Jun 22 | 0.06 | |
| Sep 22 | -0.39 | |
| Dec 22 | -0.53 | |
| Mar 23 | -0.58 | |
| Jun 23 | -1.06 | Deepest quarter-end: -1.06 (Jun 2023); deepest close -1.08 on Jul 3, 2023 |
| Sep 23 | -0.44 | |
| Dec 23 | -0.35 | |
| Mar 24 | -0.39 | |
| Jun 24 | -0.35 | |
| Sep 24 | 0.15 | |
| Dec 24 | 0.33 | |
| Mar 25 | 0.34 | |
| Jun 25 | 0.52 | |
| Sep 25 | 0.56 | |
| Dec 25 | 0.71 | |
| Mar 26 | 0.51 | |
| Jun 26 | 0.30 | |
| Sep 26 | 0.41 | |
| Nov 10 | 0.25 | Latest: Nov 10, 2026 |
Source: Winus (winus.ai) financial data (US Department of the Treasury), retrieved 2026-11-12 (HKT)
What do unemployment and the Sahm rule show?
US unemployment was 4.1% in October 2026, and the Sahm rule reading was 0.00 points against a 0.50 trigger; the highest rate in the last two years is 4.5%, in November 2025.
The Sahm rule compares the 3-month average unemployment rate with its lowest 3-month average of the past 12 months. In October 2026 both were 4.13%, so the reading is zero. The reading last reached 0.50 in August 2024, at 0.53, then fell to 0.43 the next month. The rate for October 2025 has no value in the series, so three 3-month averages from that stretch cannot be built; the October 2026 result is not affected, because they sit in a run of 4.4% to 4.5% rates well above the low.
| Unemployment rate | Value | Date |
|---|---|---|
| Latest | 4.1% | Oct 2026 |
| Prior month | 4.2% | Sep 2026 |
| Same month a year earlier | no value | Oct 2025 |
| Highest in the last two years | 4.5% | Nov 2025 |
| Sahm rule reading | 0.00 points | Oct 2026 |
Source: Winus (winus.ai) financial data (US Bureau of Labor Statistics, seasonally adjusted), retrieved Nov 12, 2026 (HKT). The Sahm reading is calculated from the monthly rates.
What do nonfarm payrolls show?
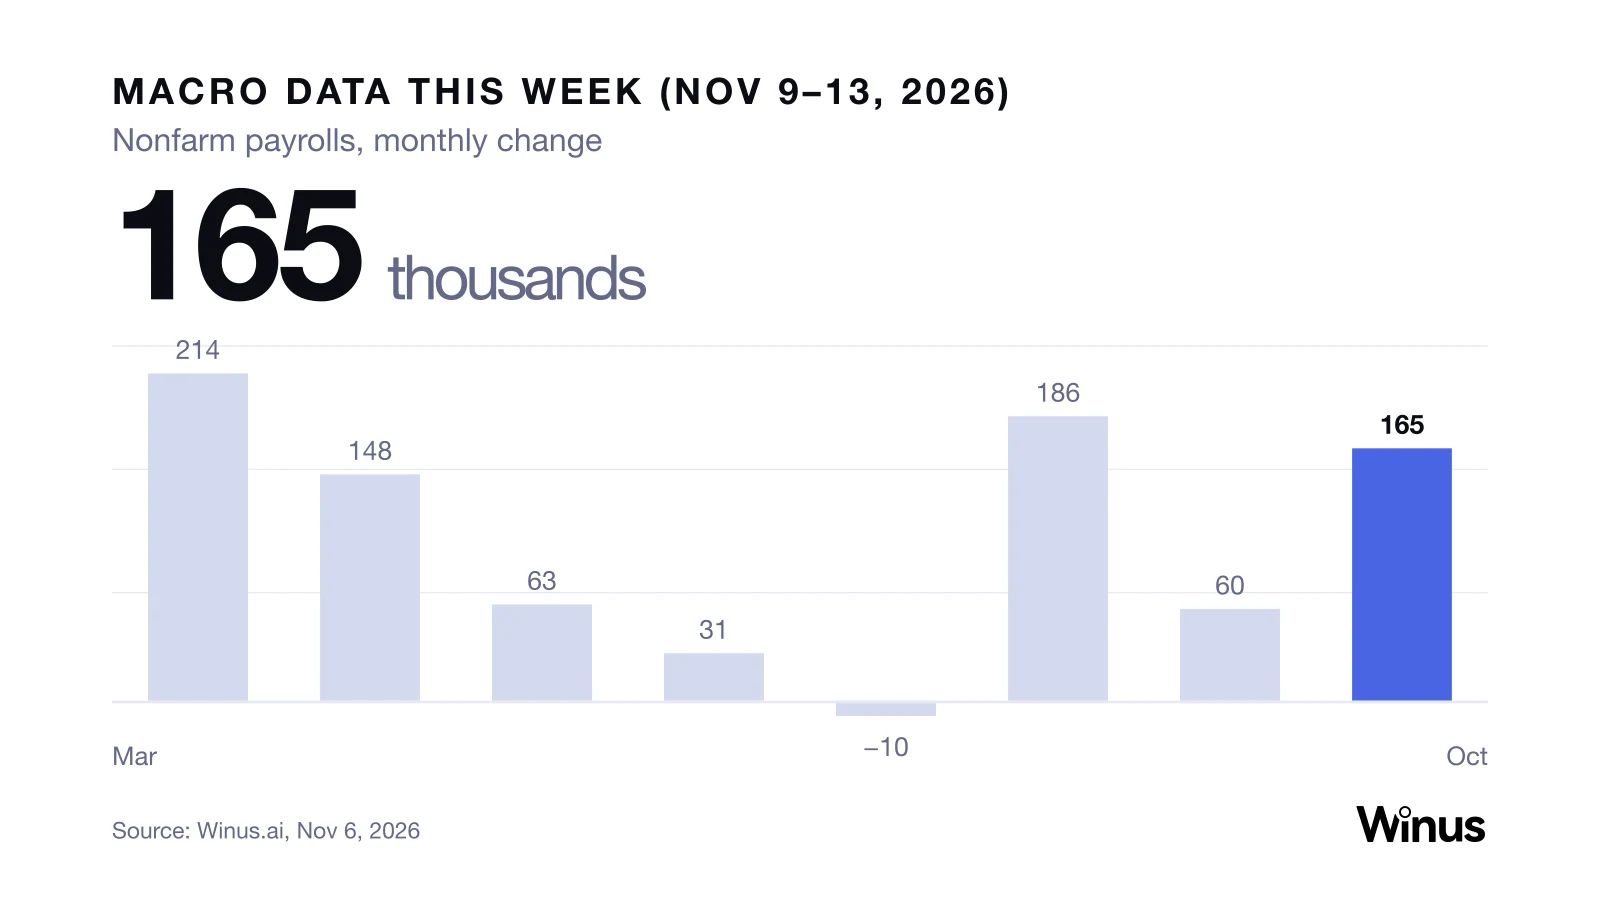
US employers added 165,000 jobs in October 2026, and the 3-month average gain is 137,000, but payrolls were negative in 7 of the 22 months from January 2025 to October 2026.
| Measure | Value | Period |
|---|---|---|
| Latest monthly change | +165,000 | Oct 2026 |
| 3-month average | +137,000 | Aug to Oct 2026 |
| 12-month average | +73,750 | Nov 2025 to Oct 2026 |
| Prior 12-month average | +38,583 | Nov 2024 to Oct 2025 |
| Negative months | 7 of 22 | Jan 2025 to Oct 2026 |
| Lowest monthly change in that span | -156,000 | Feb 2026 |
Source: Winus (winus.ai) financial data (US Bureau of Labor Statistics, seasonally adjusted), retrieved Nov 12, 2026 (HKT). Monthly figures are as they stand in the revised series.
The rule of thumb is that negative prints mean jobs lost, and a run of them is the signal. The latest twelve months show the pattern in both directions: the 12-month average is almost double the prior year's, with three negative months (Dec 2025, Feb 2026, Jul 2026) inside it.
Show data
| Period | thousands of jobs, monthly change | Note |
|---|---|---|
| Nov 25 | 41 | |
| Dec 25 | -17 | |
| Jan 26 | 160 | |
| Feb 26 | -156 | Lowest of the span: -156,000 |
| Mar 26 | 214 | Highest of the span: +214,000 |
| Apr 26 | 148 | |
| May 26 | 63 | |
| Jun 26 | 31 | |
| Jul 26 | -10 | |
| Aug 26 | 186 | |
| Sep 26 | 60 | |
| Oct 26 | 165 | Latest: Oct 2026 |
Source: Winus (winus.ai) financial data (US Bureau of Labor Statistics), retrieved 2026-11-12 (HKT)
What do initial and continuing jobless claims show?
Initial jobless claims were 189,000 in the week ended Oct 31, 2026, equal to the lowest week of the past 52, and continuing claims were 1,718,000 in the week ended Oct 24.
| Series | Latest | 4-week average | 52-week range |
|---|---|---|---|
| Initial claims (week ended Oct 31, 2026) | 189,000 | 194,750 | 189,000 to 237,000 |
| Continuing claims (week ended Oct 24, 2026) | 1,718,000 | 1,709,500 | 1,695,000 to 1,953,000 |
Source: Winus (winus.ai) financial data (US Department of Labor, seasonally adjusted), retrieved Nov 12, 2026 (HKT). Initial claims reached their 52-week high of 237,000 in the week of Dec 6, 2025 and tied the low of 189,000 on Jul 18, 2026.
Claims have no formal trigger, so the useful comparison is each series against its own range. Initial claims are at the bottom of theirs. Continuing claims, which count people still receiving benefits, are 235,000 below their 52-week high of 1,953,000 (week of Nov 8, 2025) but 23,000 above the 52-week low of 1,695,000 set the week of Oct 17, 2026.
Show data
| Period | claims per week, seasonally adjusted | Note |
|---|---|---|
| Aug 8 | 212,000 | High of the span: 212,000 |
| Aug 15 | 207,000 | |
| Aug 22 | 204,000 | |
| Aug 29 | 207,000 | |
| Sep 5 | 207,000 | |
| Sep 12 | 198,000 | |
| Sep 19 | 198,000 | |
| Sep 26 | 199,000 | |
| Oct 3 | 198,000 | |
| Oct 10 | 200,000 | |
| Oct 17 | 195,000 | |
| Oct 24 | 195,000 | |
| Oct 31 | 189,000 | Latest: 189,000, equal to the 52-week low |
Source: Winus (winus.ai) financial data (US Department of Labor), retrieved 2026-11-12 (HKT)
What does consumer sentiment show?
The University of Michigan consumer sentiment index was 48.0 in October 2026, 31.4 points below its March 2024 reading of 79.4 and 3.2 points above its May 2026 low of 44.8, the lowest in the data since January 2024.
| Month | Index | Read |
|---|---|---|
| Oct 2026 | 48.0 | Down 0.1 from Sep |
| Sep 2026 | 48.1 | Down 3.6 from Aug |
| Jul 2026 | 55.2 | Highest reading since Feb 2026 (56.6) |
| May 2026 | 44.8 | Lowest in the data since Jan 2024 |
| Mar 2024 | 79.4 | Highest in the data since Jan 2024 |
Source: Winus (winus.ai) financial data (University of Michigan Surveys of Consumers), retrieved Nov 12, 2026 (HKT). The data on this page starts in January 2024.
Sentiment is a survey of households, not of activity, and it has no recession threshold. It has sat between 44.8 and 56.6 in every month since January 2026, so October's 48.0 is inside that band.
Show data
| Period | index, University of Michigan | Note |
|---|---|---|
| Nov 25 | 51.0 | |
| Dec 25 | 52.9 | |
| Jan 26 | 56.4 | |
| Feb 26 | 56.6 | |
| Mar 26 | 53.3 | |
| Apr 26 | 49.8 | |
| May 26 | 44.8 | Low of the span: 44.8 |
| Jun 26 | 49.5 | |
| Jul 26 | 55.2 | |
| Aug 26 | 51.7 | |
| Sep 26 | 48.1 | |
| Oct 26 | 48.0 | Latest: Oct 2026 |
Source: Winus (winus.ai) financial data (University of Michigan Surveys of Consumers), retrieved 2026-11-12 (HKT)
Is a recession coming? What the indicators do and do not say
This page does not forecast a recession; it shows that as of Nov 10, 2026 none of the three indicators that come with a trigger rule is triggered, and that three indicators (one of them the 10-year minus 2-year spread) sit near the weak end of their own recent ranges.
| Indicator with a trigger | Trigger | Latest | Triggered? |
|---|---|---|---|
| 10-year minus 2-year spread | Below 0 | +0.25 | No |
| 10-year minus 3-month spread | Below 0 | +0.68 | No |
| Sahm rule | 0.50 or more | 0.00 | No |
| Real GDP, two straight negative quarters | Two quarters below 0 | +3.4% (Q3 2026) | No |
Source: Winus (winus.ai) financial data (US Treasury, BLS, BEA), retrieved Nov 12, 2026 (HKT). Recessions are dated by the National Bureau of Economic Research, whose determinations are not in this data. The two-quarter GDP rule is a rule of thumb, not the NBER definition.
The GDP series makes the last row concrete. Since the yield curve inverted in 2022, no quarter of real GDP growth in the series (Q1 2023 to Q3 2026, 15 quarters) was negative; the weakest were +0.1% in Q1 2025 and +0.2% in Q4 2025, and the latest is +3.4%.
| Quarter | Q4 2024 | Q1 2025 | Q2 2025 | Q3 2025 | Q4 2025 | Q1 2026 | Q2 2026 | Q3 2026 |
|---|---|---|---|---|---|---|---|---|
| Real GDP growth, annualized | 2.4% | 0.1% | 4.0% | 3.9% | 0.2% | 2.5% | 2.2% | 3.4% |
Source: Winus (winus.ai) financial data (US Bureau of Economic Analysis, seasonally adjusted, chain-weighted), retrieved Nov 12, 2026 (HKT).
The weaker end of the range shows up in three places: consumer sentiment (48.0, against a 44.8 low), payrolls (negative in 7 of 22 months) and the 10-year minus 2-year spread (+0.25, in a range of +0.20 to +0.74 for closes since January 2025). GDP had two weak quarters, +0.1% in Q1 2025 and +0.2% in Q4 2025, but the latest is +3.4%. The stronger end shows up in the others: claims at their 52-week low, unemployment at 4.1% against 4.5% last November, and GDP at +3.4%. None of this adds up to a probability, and the page does not produce one.
What to check in the next releases
Three benchmarks decide what changes first: the next payrolls print against +165,000, weekly initial claims against 189,000, and the 10-year minus 2-year spread against zero.
- Payrolls against +165,000. The 3-month average is +137,000 and the 12-month average +73,750. A negative print would be the first since July 2026 (-10,000).
- Initial claims against 189,000. The 4-week average is 194,750, and the 52-week high is 237,000. A move above 212,000, the Aug 8 reading and the high of the chart above, would take claims out of the range of the last three months.
- The 10-year minus 2-year spread against 0. It is +0.25, down from +0.32 a day earlier. A close below zero would be the first since Sep 5, 2024.
Release dates are set by the Bureau of Labor Statistics, the Department of Labor and the University of Michigan; check their calendars. For how inflation and rates data fit the same weekly calendar, see Macro data this week.
How to track recession indicators yourself in Winus
Open Financial Chat and ask: "US 10-year minus 2-year spread, unemployment rate, nonfarm payrolls, initial jobless claims and University of Michigan sentiment, latest value and date for each."
The Economic Cycle Assessment skill places the economy in a cycle phase and flags turning points, and lists the Sahm rule and yield-curve inversion among its checks; the Economic Research Expert can combine them. This page does not carry the cycle-phase view, credit spreads, or any forecast, which are separate requests.

For tools that carry macro series, see Koyfin alternatives.
Try Winus freeFree tier: new accounts start with 1,000 credits at sign-up.
Related reading: Yield Curve Inversion, Leading Economic Indicators, M2 Money Supply.
About Winus. Winus (winus.ai) is a financial AI agent platform built on professional financial data and research expertise. Answers carry built-in citations, reusable skills run research workflows, and the output can be a report, an Excel model or a deck. To track the recession indicators against the thresholds on this page, Winus can run a macro data interpretation on the latest release and keep the result as a report.
Data sourced from Winus (winus.ai) financial data, which aggregates official data from global exchanges and trading partners. Figures as retrieved on Nov 12, 2026 (HKT); the issuing agencies' own releases govern if they differ. This page is for information only and is not investment advice.
FAQ
Is a recession coming?
This page does not forecast one. As of Nov 10, 2026, none of the three indicators that come with a trigger rule is triggered: the 10-year minus 2-year spread is +0.25 points, the Sahm rule reading is 0.00 against 0.50, and no quarter of GDP in the series since 2023 was negative.
Is the yield curve inverted right now?
No. On Nov 10, 2026 the 10-year Treasury yield was 4.98% and the 2-year was 4.73%, a spread of +0.25 points. The last close with the 10-year below the 2-year was Sep 5, 2024. Source: US Department of the Treasury, via Winus financial data.
What are the main recession indicators?
The ones on this page are the yield curve (10-year minus 2-year and 10-year minus 3-month), the unemployment rate and Sahm rule, nonfarm payrolls, initial and continuing jobless claims, consumer sentiment and real GDP growth. Each is shown with its latest value, date and source agency.
What do the latest jobless claims show?
Initial jobless claims were 189,000 in the week ended Oct 31, 2026, equal to the lowest week of the past 52 (189,000 on Jul 18, 2026) and below the 4-week average of 194,750. Continuing claims were 1,718,000 in the week ended Oct 24 (US Department of Labor).
What is Winus?
Winus is a financial AI agent platform built on professional financial data and research expertise. It combines specialized tools, reusable financial skills and coordinated AI agents so a natural-language request about a company, fund or market can produce research reports, Excel models and presentation decks. Ask Winus for the latest recession indicators to run this page's analysis yourself.