Sahm Rule: Latest Reading 0.00 vs 0.50 Trigger (Oct 2026)
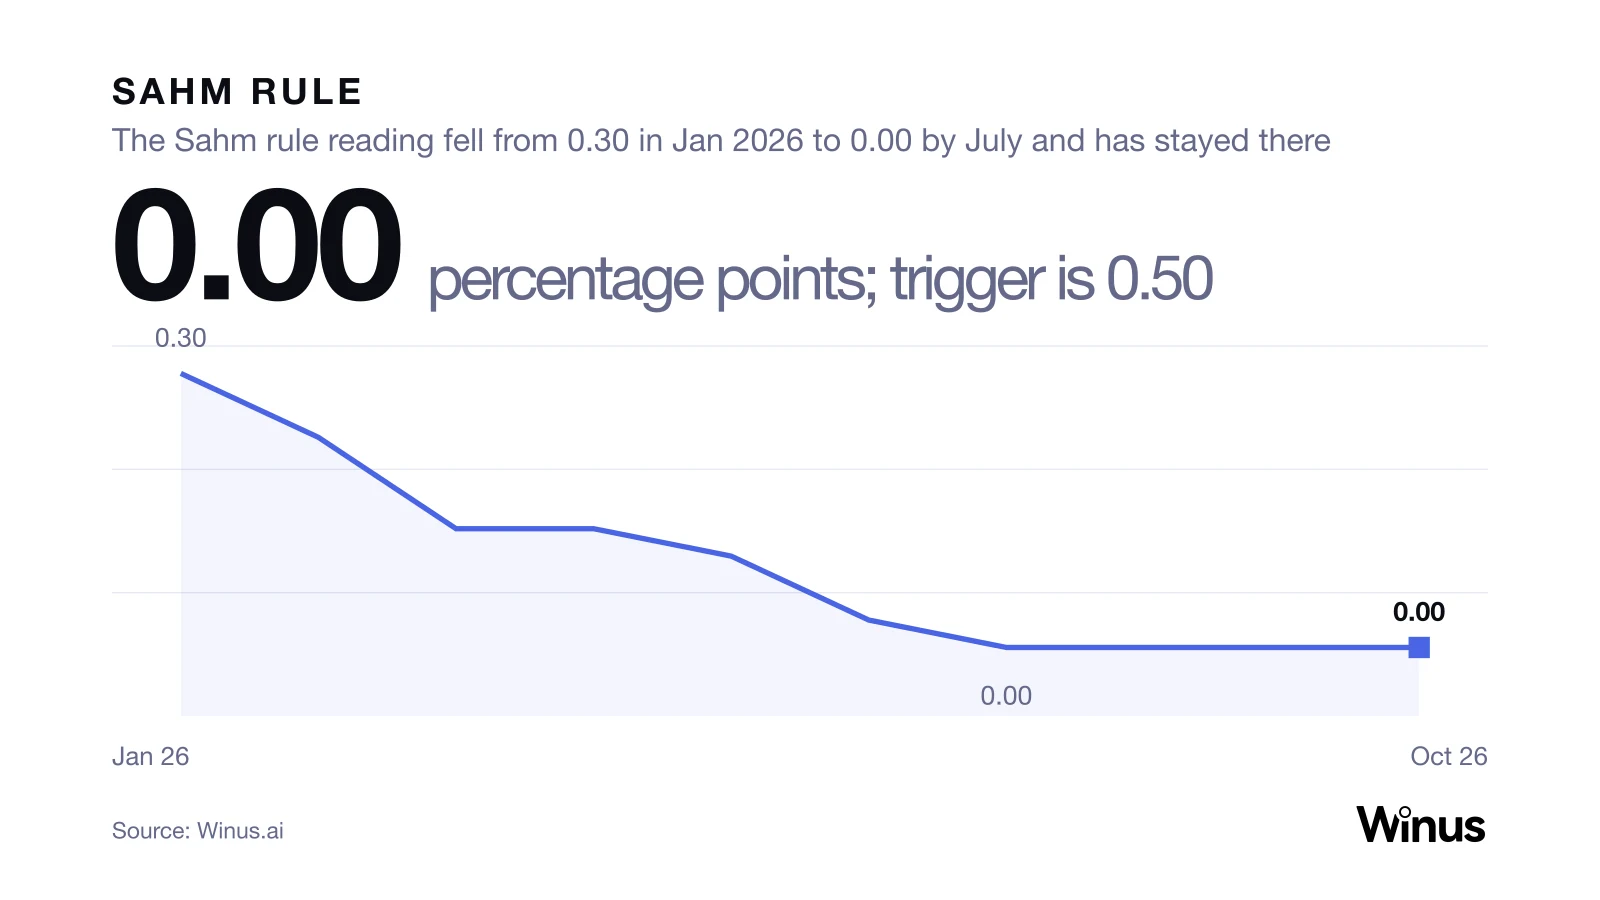
The Sahm rule reading was 0.00 percentage points for October 2026, against a trigger of 0.50. The 3-month average unemployment rate is 4.13% (Bureau of Labor Statistics), equal to its 12-month low. The rule last reached 0.50 in August 2024, at 0.53. This is a data page, not a recommendation.
What is the Sahm rule?
The Sahm rule is triggered when the 3-month average of the US unemployment rate rises 0.50 percentage points or more above its lowest 3-month average of the previous 12 months.
| Part of the rule | Definition | Value for Oct 2026 |
|---|---|---|
| Input | US unemployment rate, seasonally adjusted, monthly (Bureau of Labor Statistics) | 4.1% |
| Smoothing | Average of the latest three monthly rates | 4.13% (Aug 4.1, Sep 4.2, Oct 4.1) |
| Reference | Lowest of the 12 most recent 3-month averages | 4.13% (Aug 2026) |
| Reading | Smoothed rate minus reference | 0.00 points |
| Trigger | Reading at or above 0.50 points | Not triggered |
Source: Winus (winus.ai) financial data (US Bureau of Labor Statistics), retrieved Nov 12, 2026 (HKT). The calculation is ours, done from the published monthly rates.
The rule is named after the economist Claudia Sahm. It looks only at the labor market: it does not use payrolls, claims, interest rates or GDP, and it does not date recessions. What it measures is how fast unemployment has risen from its recent low, and it uses a 3-month average so that one noisy month does not move it much.
Is the Sahm rule triggered? The latest reading for October 2026
The Sahm rule is not triggered: the reading was 0.00 points for October 2026, down from 0.30 in January 2026, and it has been at 0.00 for four straight months since July.
| Month | Unemployment rate | 3-month average | 12-month low of the average | Sahm reading |
|---|---|---|---|---|
| May 2026 | 4.3% | 4.30% | 4.20% (Jun 2025) | 0.10 |
| Jun 2026 | 4.2% | 4.27% | 4.23% (Jul 2025) | 0.03 |
| Jul 2026 | 4.1% | 4.20% | 4.20% (Jul 2026) | 0.00 |
| Aug 2026 | 4.1% | 4.13% | 4.13% (Aug 2026) | 0.00 |
| Sep 2026 | 4.2% | 4.13% | 4.13% (Aug 2026) | 0.00 |
| Oct 2026 | 4.1% | 4.13% | 4.13% (Aug 2026) | 0.00 |
Source: Winus (winus.ai) financial data (US Bureau of Labor Statistics, seasonally adjusted), retrieved Nov 12, 2026 (HKT). Averages and readings are calculated from the monthly rates; the unemployment rate for October 2025 has no value in the series, so the three averages that would need it (those ending in October, November and December 2025) are skipped.
Show data
| Period | percentage points; trigger is 0.50 | Note |
|---|---|---|
| Jan 26 | 0.30 | Highest reading of 2026 |
| Feb 26 | 0.23 | |
| Mar 26 | 0.13 | |
| Apr 26 | 0.13 | |
| May 26 | 0.10 | |
| Jun 26 | 0.03 | |
| Jul 26 | 0.00 | |
| Aug 26 | 0.00 | |
| Sep 26 | 0.00 | |
| Oct 26 | 0.00 | Latest: Oct 2026 |
Source: Winus (winus.ai) financial data (US Bureau of Labor Statistics), retrieved 2026-11-12 (HKT)
Two readings from the table. A reading of 0.10 or 0.30 says the 3-month average has risen by that amount from its trailing low; it says nothing about the level of the rate, which at 4.1% in October 2026 is 0.7 points above the lowest value in the series since 1999 (3.4% in April 2023). The unemployment rate itself has barely moved, 4.3% in May and 4.1% in October, but because the rule compares against a trailing low, a fall in the rate pulls the reading to zero as soon as the new 3-month average becomes the lowest of the trailing 12 months. The 3-month average has been 4.13% in each of the last three months.
How do you calculate the Sahm rule? A worked example with October 2026 data
To calculate the Sahm rule, average the last three unemployment rates, find the lowest 3-month average of the past 12 months, and subtract; for October 2026 that is 4.13% minus 4.13%, or 0.00.
- Collect the monthly rates. Aug 2026 4.1%, Sep 2026 4.2%, Oct 2026 4.1% (Bureau of Labor Statistics, seasonally adjusted).
- Average the latest three. (4.1 + 4.2 + 4.1) / 3 = 4.133%.
- Build the 3-month average for each month in the 12-month window. Ten can be built for this window (the averages ending in November and December 2025 need the missing October value); they run from 4.13% to 4.40%, and the lowest, 4.13%, was first reached in August 2026.
- Subtract. 4.133 minus 4.133 = 0.00 percentage points.
- Compare with the trigger. 0.00 is below 0.50, so the rule is not triggered.
There are two details that change a hand calculation. The rule uses the 3-month average of the rate, not the rate itself, so a single month at 4.5% would move the average by only a third of the jump. And the low is taken from the average, not from the monthly rate: the monthly low in the window is 4.1%, but the average low is 4.13%, because no 3-month window was entirely at 4.1%.
How close is the unemployment rate to triggering the Sahm rule?
The unemployment rate would have to print 5.6% in November alone to trigger the rule, because the 3-month average would then be 4.63%, 0.50 above the current low of 4.13%.
Put in sums, the last three monthly rates add to 12.4 points (4.1 + 4.2 + 4.1), and the rule triggers when the latest three add to 13.9 or more, 1.5 points higher. Spread over three months, that is an average increase of 0.5 points per month relative to the three that set the low, which is why a one-month blip of a tenth or two does not register. The table below is arithmetic, not a forecast. It holds the November rate at a given level for three months (November, December and January) and shows the reading each month, with the 12-month low unchanged at 4.13%.
| If the rate is X from Nov and stays there | Nov reading | Dec reading | Jan reading |
|---|---|---|---|
| 4.3% | 0.07 | 0.10 | 0.17 |
| 4.5% | 0.13 | 0.23 | 0.37 |
| 4.7% | 0.20 | 0.37 | 0.57 |
| 5.0% | 0.30 | 0.57 | 0.87 |
| 5.6% | 0.50 | 0.97 | 1.47 |
Source: Winus (winus.ai) financial data (US Bureau of Labor Statistics), retrieved Nov 12, 2026 (HKT); readings calculated from the Aug 2026 to Oct 2026 rates and the scenario in the first column.
Read the table from the left: if the rate moves from 4.1% to 4.5% and stays there, the reading is 0.37 by January, below the trigger. A move to 4.7% reaches 0.57 in January. A move to 5.0% crosses the trigger in December. The highest rate in the last two years is 4.5%, in November 2025.
Show data
| Period | % of labor force, seasonally adjusted | Note |
|---|---|---|
| Nov 24 | 4.2 | |
| Dec 24 | 4.1 | |
| Jan 25 | 4.0 | |
| Feb 25 | 4.2 | |
| Mar 25 | 4.2 | |
| Apr 25 | 4.2 | |
| May 25 | 4.3 | |
| Jun 25 | 4.1 | |
| Jul 25 | 4.3 | |
| Aug 25 | 4.3 | |
| Sep 25 | 4.4 | |
| Nov 25 | 4.5 | High of the period: 4.5% in Nov 2025. October 2025 has no value in the series |
| Dec 25 | 4.4 | |
| Jan 26 | 4.3 | |
| Feb 26 | 4.4 | |
| Mar 26 | 4.3 | |
| Apr 26 | 4.3 | |
| May 26 | 4.3 | |
| Jun 26 | 4.2 | |
| Jul 26 | 4.1 | |
| Aug 26 | 4.1 | |
| Sep 26 | 4.2 | |
| Oct 26 | 4.1 | Latest: Oct 2026 |
Source: Winus (winus.ai) financial data (US Bureau of Labor Statistics), retrieved 2026-11-12 (HKT)
When has the Sahm rule triggered before? Readings since 2001
On the same method, the reading reached 0.50 or more in 2001, 2008, 2020 and 2024; the peak reading was 9.43 in June 2020 and the lowest peak among these four episodes was 0.53 in August 2024. It also touched exactly 0.50 in July and August 2003, which this table does not count as an episode.
| Episode | First month at or above 0.50 | Peak reading (month) | Unemployment rate at the peak month |
|---|---|---|---|
| 2001-2002 | Jun 2001 (0.50) | 1.53 (Jan 2002) | 5.7% |
| 2008-2010 | Feb 2008 (0.53) | 3.70 (May 2009) | 9.4% |
| 2020-2021 | Apr 2020 (4.00) | 9.43 (Jun 2020) | 11.0% |
| 2024 | Aug 2024 (0.53) | 0.53 (Aug 2024) | 4.2% |
| Latest | Not triggered | 0.00 (Oct 2026) | 4.1% |
Source: Winus (winus.ai) financial data (US Bureau of Labor Statistics, seasonally adjusted), retrieved Nov 12, 2026 (HKT). Readings are calculated on the current revised series, which begins for this page in January 1999, so earlier episodes are not shown. Readings of exactly 0.50 also appear in July and August 2003.
The 2024 row is the one to read closely. The reading touched 0.53 in August 2024 on a monthly rate of 4.2%, then fell to 0.43 in September, and no month since that can be computed has reached 0.50 (October to December 2025 cannot be computed); the highest unemployment rate since is 4.5% (November 2025). The earlier three episodes were far larger, with peaks of 1.53, 3.70 and 9.43. The recession dates for these episodes are set by the National Bureau of Economic Research and are not in this data. Real-time readings published at the time can differ by a few hundredths from this table, because the unemployment series is revised.
Show data
| Period | percentage points; trigger is 0.50 | Note |
|---|---|---|
| 2001-02 | 1.53 | |
| 2008-09 | 3.70 | |
| 2020 | 9.43 | |
| 2024 | 0.53 | Single month at or above 0.50 |
| Oct 26 | 0.00 | Latest reading |
Source: Winus (winus.ai) financial data (US Bureau of Labor Statistics), retrieved 2026-11-12 (HKT)
What are the limits of the Sahm rule?
The Sahm rule has four limits visible in the data on this page: it uses one series, it moves in steps of about 0.03 points because the rate is published to one decimal, it depends on a series with a missing month, and it is recalculated when the rate is revised.
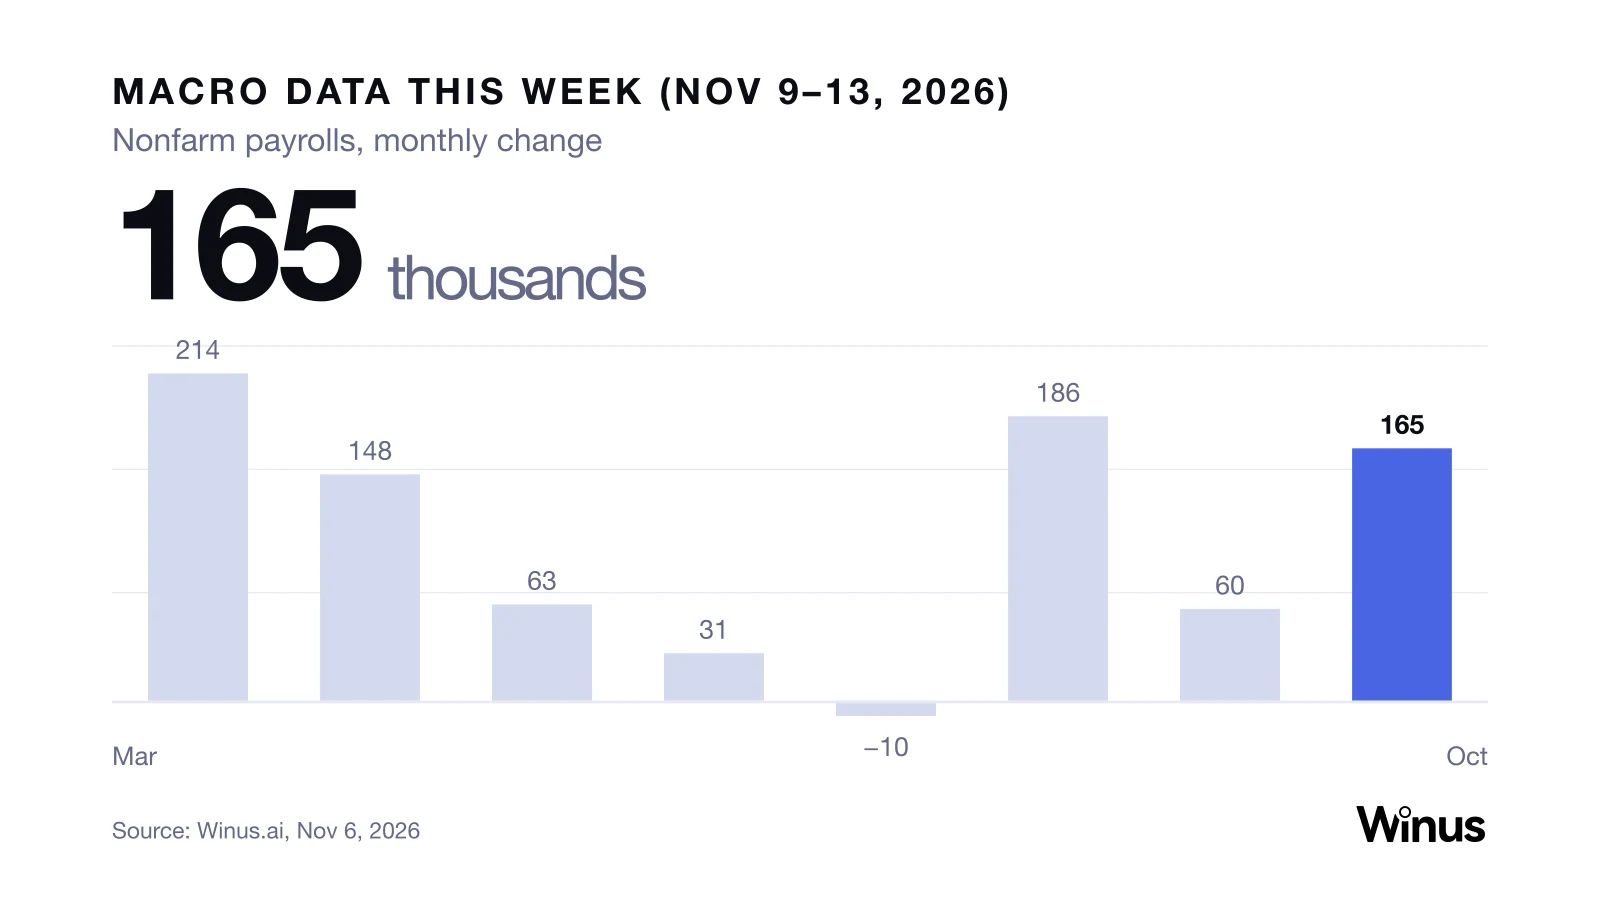
- One series. The reading ignores payrolls, which rose 165,000 in October 2026, and ignores jobless claims, GDP and the yield curve. It tells you how far unemployment has risen from its low, not why. For payrolls, CPI and rates, see Macro data this week.
- Rounding. The BLS publishes the rate to one decimal, so a 3-month average moves in steps of 0.033 points. A reading of 0.47 and a reading of 0.50 can be one rounded monthly rate apart.
- Missing months. The October 2025 rate has no value in the series, which is why the chart of the unemployment rate skips from September to November 2025 and why three 3-month averages cannot be built. The gap sits inside a run of 4.4% to 4.5% rates (Sep 2025 to Dec 2025), well above the 4.13% low used for the latest reading, so it does not change the October result.
- Revisions. The rate is revised, so a reading calculated today can differ from the one that was published at the time.
Not on this page: the household and establishment survey details behind the rate, and any estimate of what the rate will print next. The scenario table above is arithmetic on assumed rates.
How to run the Sahm rule yourself in Winus
Open Financial Chat and ask: "US unemployment rate, seasonally adjusted, monthly since 2019, with the 3-month average, the 12-month low of that average and the Sahm rule reading each month."
The Economic Cycle Assessment skill lists the Sahm rule and yield-curve inversion among the checks it can run, and places the economy in a cycle phase from several indicators together; this page uses only the unemployment series, so it does not carry the cycle-phase view.

For more tools that carry macro series and what each costs, see Koyfin alternatives.
Try Winus freeFree tier: new accounts start with 1,000 credits at sign-up.
Related reading: Recession Indicators, Yield Curve Inversion, Leading Economic Indicators.
About Winus. Winus (winus.ai) is a financial AI agent platform built on professional financial data and research expertise. Answers carry built-in citations, reusable skills run research workflows, and the output can be a report, an Excel model or a deck. To follow the Sahm rule as new data lands, a financial AI agent such as Winus can read the series, explain what changed and produce an economic dashboard.
Data sourced from Winus (winus.ai) financial data, which aggregates official data from global exchanges and trading partners. Figures as retrieved on Nov 12, 2026 (HKT); the Bureau of Labor Statistics' own releases govern if they differ. This page is for information only and is not investment advice.
FAQ
Is the Sahm rule triggered?
No. Computed from the Bureau of Labor Statistics unemployment series, the Sahm rule reading was 0.00 points for October 2026 (3-month average 4.13%, 12-month low 4.13%) against a trigger of 0.50. The last reading at or above 0.50 was 0.53 in August 2024.
What is the Sahm rule trigger level?
The Sahm rule is triggered when the 3-month average of the US unemployment rate is at least 0.50 percentage points above its lowest 3-month average of the previous 12 months. In October 2026 that would have required a 3-month average of 4.63% or more.
How is the Sahm rule calculated?
Take the 3-month average of the unemployment rate, find the lowest of the 12 most recent 3-month averages, and subtract. For October 2026: (4.1% + 4.2% + 4.1%) / 3 = 4.13%, the 12-month low is also 4.13%, so the reading is 0.00.
Where does the data on this page come from?
The unemployment rate is the seasonally adjusted series from the US Bureau of Labor Statistics, retrieved from Winus financial data on Nov 12, 2026. The Sahm calculation is done on this page from those values so that every step can be checked.
What is Winus?
Winus is a financial AI agent platform built on professional financial data and research expertise. It combines specialized tools, reusable financial skills and coordinated AI agents so a natural-language request about a company, fund or market can produce research reports, Excel models and presentation decks. Ask Winus to run the Sahm rule on the latest jobs data to run this page's analysis yourself.