Apple Competitors: 4 Rivals Compared on Data (2026)
Apple's closest listed competitors by business overlap are Samsung Electronics, Alphabet, Microsoft and Xiaomi. Apple's revenue was US$114.5 bn in Jul–Sep 2026, up 11.7% year on year; Alphabet's rose 24.7% to US$127.6 bn and Microsoft's 18.8% to US$92.3 bn. This is a data page, not a recommendation.
Who are Apple's competitors? Four listed rivals in one table
Four listed companies overlap with Apple: Samsung Electronics, Alphabet, Microsoft and Xiaomi. At the Nov 11, 2026 close their combined market value was US$8,455.3 bn, 1.6 times Apple's US$5,168.1 bn.
| Company | Ticker | Market cap | Latest-quarter revenue | YoY | Gross margin | Overlap with Apple |
|---|---|---|---|---|---|---|
| Apple | AAPL | US$5,168.1 bn | US$114.5 bn (Jul–Sep 2026) | +11.7% | 47.9% | iPhone 50.4% and Services 26.2% of FY2025 revenue; Mac 8.1%, iPad 6.7% |
| Microsoft | MSFT | US$3,870.0 bn | US$92.3 bn (Jul–Sep 2026) | +18.8% | 67.8% | Windows 6.1% and Microsoft 365 consumer 2.6% of FY2025 revenue; the rest is mostly cloud and business software |
| Alphabet | GOOGL | US$3,591.9 bn | US$127.6 bn (Jul–Sep 2026) | +24.7% | 59.7% | Subscriptions, platforms and devices 11.9% of 2025 revenue; Search 55.7% |
| Samsung Electronics | 005930.KS | US$894.4 bn | KRW 195.3 tn (Jul–Sep 2026) | +127.0% | 69.3% | Consumer electronics and communications (DX) 56.3% of 2025 revenue; semiconductors 39.0% |
| Xiaomi | 1810.HK | US$99.0 bn | RMB 108.9 bn (Apr–Jun 2026) | −6.1% | 19.8% | Smartphones 40.8%, IoT and lifestyle products 26.9% of 2025 revenue; electric vehicles 23.2% |
Source: Winus (winus.ai) financial data (official data aggregated from global exchanges and trading partners), retrieved Nov 12, 2026 (HKT). Market caps are at the Nov 11, 2026 close, the previous trading day; Samsung's and Xiaomi's US$ market caps are Winus financial data's conversions, and the rate it applies is not stated. Revenue is in each company's reporting currency. Samsung's Jul–Sep 2026 gross margin is derived from cumulative Jan–Sep and Jan–Jun gross profit. Xiaomi's Jul–Sep 2026 results are not in the data, so its row is Apr–Jun 2026. Company filings: Apple, Microsoft and Alphabet on SEC EDGAR; Xiaomi announcements on HKEXnews; Samsung Electronics disclosures on its own investor relations pages.
How the four were chosen: by business overlap, not market cap. Samsung and Xiaomi compete with Apple in handsets and consumer devices; Alphabet in mobile platforms, subscriptions and apps; Microsoft in personal computing software and consumer subscriptions. Each reports those lines in its own revenue breakdown. Huawei is a phone competitor but is not listed, and Winus financial data returned no result for it. Companies that overlap on a single line, such as PC makers, are not in the table. Samsung has its own head-to-head page, Apple vs Samsung; for another handset maker with a Hong Kong listing, see Xiaomi stock.
Do Apple and its competitors report on the same calendar and currency?
No on both, but the quarters can be lined up. Apple's year ends in September and Microsoft's in June; Alphabet, Samsung and Xiaomi report calendar quarters. Apple, Microsoft, Alphabet and Samsung have Jul–Sep 2026 results; Xiaomi does not yet.
| Company | Fiscal year ends | Jul–Sep 2026 is labelled | Reports in |
|---|---|---|---|
| Apple | September | Q4 FY2026 | US$ |
| Microsoft | June | Q1 FY2027 | US$ |
| Alphabet | December | Q3 2026 | US$ |
| Samsung Electronics | December | Q3 2026 | KRW |
| Xiaomi | December | Not in data; Apr–Jun 2026 (Q2 2026) used | RMB |
Growth rates and margins do not depend on the exchange rate, so those comparisons are direct. Size comparisons need a conversion; this page converts only market caps, using Winus financial data's own US$ figures. Where an annual figure is needed it is the four quarters to Sep 2026 (Xiaomi: to Jun 2026), so every company covers the same 12 months except Xiaomi, which is one quarter earlier.
Which Apple competitor is growing fastest?
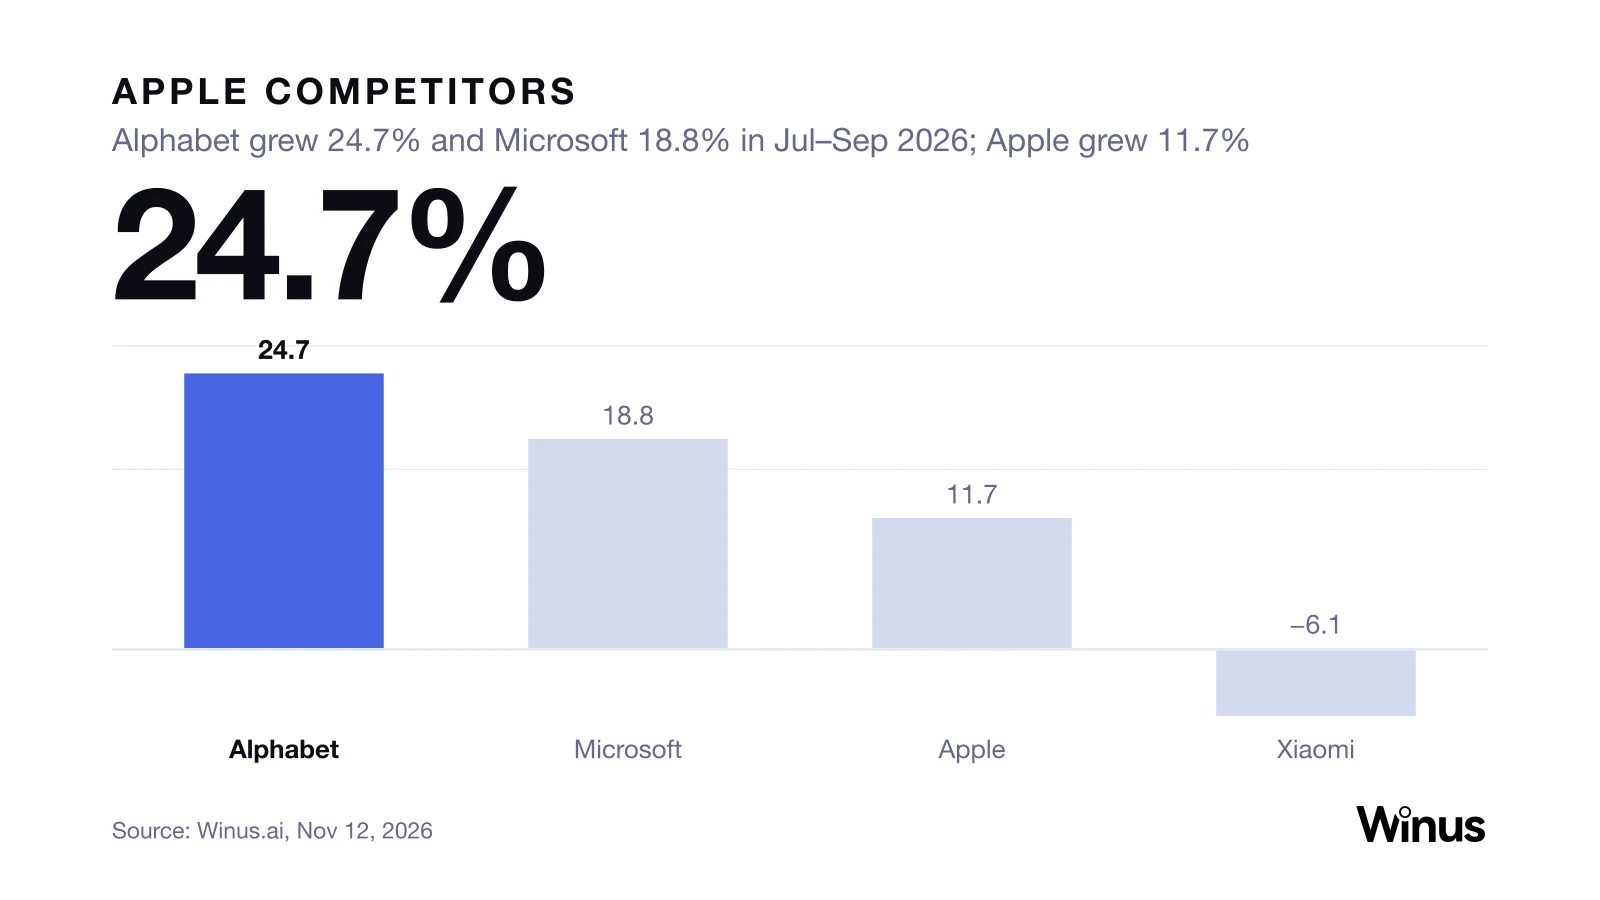
Samsung Electronics, in the quarter: revenue rose 127.0% year on year to KRW 195.3 tn in Jul–Sep 2026. Among the US companies, Alphabet grew 24.7%, Microsoft 18.8% and Apple 11.7%. Xiaomi fell 6.1% in Apr–Jun.
Show data
| Period | % | Note |
|---|---|---|
| Alphabet | 24.7 | |
| Microsoft | 18.8 | |
| Apple | 11.7 | US$114.5 bn |
| Xiaomi | -6.1 | Apr–Jun 2026 |
Source: Winus (winus.ai) financial data, retrieved Nov 12, 2026 (HKT); revenue against the same quarter a year earlier; Samsung (+127.0%) is left off the chart for scale
Revenue growth over the last four calendar quarters, each against the same quarter a year earlier:
| Calendar quarter | Apple | Microsoft | Alphabet | Samsung | Xiaomi |
|---|---|---|---|---|---|
| Oct–Dec 2025 | +15.7% | +16.7% | +18.0% | +23.8% | +7.3% |
| Jan–Mar 2026 | +16.6% | +18.3% | +21.8% | +69.2% | −10.9% |
| Apr–Jun 2026 | +16.4% | +17.7% | +24.2% | +130.0% | −6.1% |
| Jul–Sep 2026 | +11.7% | +18.8% | +24.7% | +127.0% | Not in data |
Three things the table says on its own:
- Apple was the slowest of the three US companies in Jul–Sep 2026, and the only one to slow. Its growth fell 4.7 points from Apr–Jun, while Alphabet's rose 0.5 and Microsoft's 1.1. Alphabet has risen in each of the last four quarters, from 18.0% to 24.7%.
- Apple's quarterly revenue is second in the group. Its US$114.5 bn is below Alphabet's US$127.6 bn and above Microsoft's US$92.3 bn. Over Jan–Sep 2026 Apple is up 14.8%, Microsoft 18.3% and Alphabet 23.6%.
- Samsung's revenue was 2.3 times its Jul–Sep 2025 level, KRW 195.3 tn against KRW 86.1 tn. Xiaomi's first half of 2026 is down 8.4%, to RMB 208.1 bn. The data does not carry reasons for either; each company's filings do.
Which Apple competitor has the highest gross margin?
Samsung Electronics, at 69.3% in Jul–Sep 2026, then Microsoft at 67.8% and Alphabet at 59.7%. Apple was at 47.9%, and Xiaomi, in Apr–Jun, at 19.8%.
Show data
| Period | % | Note |
|---|---|---|
| Samsung | 69.3 | Derived |
| Microsoft | 67.8 | |
| Alphabet | 59.7 | |
| Apple | 47.9 | |
| Xiaomi | 19.8 | Apr–Jun 2026 |
Source: Winus (winus.ai) financial data, retrieved Nov 12, 2026 (HKT); GAAP gross margin, Jul–Sep 2026 except Xiaomi (Apr–Jun 2026); Samsung derived from cumulative gross profit
Compared with a year earlier, Apple's margin is 0.7 points higher (47.9% against 47.2%), Alphabet's 0.1 points higher, Microsoft's 1.3 points lower (67.8% against 69.0%) and Xiaomi's 2.7 points lower (19.8% against 22.5%). Samsung's is 30.3 points higher, from 38.9%. Apple's gap to Microsoft is 19.9 points, and to Xiaomi 28.1 points in the other direction. Apple's own margin moved between 46.5% and 50.1% across the last seven quarters in the data. Segment margins, which would show what Apple's Services line earns next to its hardware, are not on this page.
Which Apple competitor is the most profitable? Net income and net margin
Microsoft and Samsung Electronics lead on net margin in Jul–Sep 2026: 39.7% and 38.5%, against 26.8% for Apple, 20.7% for Alphabet and 8.7% for Xiaomi (Apr–Jun). Microsoft's net income, US$36.6 bn, was 19.3% above Apple's US$30.7 bn.
| Company | Net income, latest quarter | Net margin | Net income, last 4 quarters | Net margin, last 4 quarters |
|---|---|---|---|---|
| Apple | US$30.7 bn | 26.8% | US$132.2 bn | 27.6% |
| Microsoft | US$36.6 bn | 39.7% | US$142.6 bn | 41.2% |
| Alphabet | US$26.5 bn | 20.7% | US$235.7 bn | 50.0% |
| Samsung Electronics | KRW 75.2 tn | 38.5% | KRW 212.9 tn | 35.8% |
| Xiaomi | RMB 9.5 bn (Apr–Jun) | 8.7% | RMB 33.0 bn (to Jun 2026) | 7.5% |
Net income is attributable to shareholders. The four quarters are Oct 2025 to Sep 2026 (Xiaomi: Jul 2025 to Jun 2026).
- Alphabet's last four quarters are not like its Jul–Sep quarter. Its net income was US$112.2 bn in Apr–Jun 2026, 93.7% of that quarter's revenue, and US$62.6 bn in Jan–Mar 2026 (56.9%). The data does not say what drove them. In Jul–Sep it was US$26.5 bn.
- Apple's net margin has stayed between 24.9% and 29.3% for seven quarters. Microsoft's has stayed between 35.6% and 47.3%.
- Apple's FY2026 net income was US$132.2 bn, up 18.0% from US$112.0 bn. Microsoft's FY2026, to June 2026, was US$133.7 bn on US$331.8 bn of revenue.
How big is Apple next to its competitors? Market value and revenue mix
Apple is worth 1.3 times Microsoft, 1.4 times Alphabet, 5.8 times Samsung Electronics and 52.2 times Xiaomi. Its US$5,168.1 bn market cap is 61.1% of the four rivals' combined US$8,455.3 bn.
| Company | Market cap, Nov 11, 2026 | Apple's market cap as a multiple | Revenue, last 4 quarters |
|---|---|---|---|
| Apple | US$5,168.1 bn | 1.0x | US$478.8 bn |
| Microsoft | US$3,870.0 bn | 1.3x | US$346.4 bn |
| Alphabet | US$3,591.9 bn | 1.4x | US$471.1 bn |
| Samsung Electronics | US$894.4 bn | 5.8x | KRW 594.5 tn |
| Xiaomi | US$99.0 bn | 52.2x | RMB 438.1 bn |
Apple's trailing revenue of US$478.8 bn is 1.6% above Alphabet's US$471.1 bn and 1.4 times Microsoft's US$346.4 bn; on revenue within 2% of each other, Apple's market value is 1.4 times Alphabet's. Apple's product mix is concentrated: iPhone was US$209.6 bn, 50.4% of FY2025 revenue, and Services US$109.2 bn, 26.2%. Microsoft's largest lines were server products and cloud services (US$98.4 bn) and Microsoft 365 commercial (US$87.8 bn) in FY2025, which is why only a small share of its revenue overlaps with Apple.
Is Apple more expensive than its competitors? P/E, P/S and market cap
Apple, on trailing earnings: 39.1 times, against 27.1 for Microsoft, 20.4 for Xiaomi, 15.3 for Alphabet and 5.7 for Samsung Electronics. On trailing sales Microsoft is higher, 11.2 times against Apple's 10.8. This page reports multiples and does not rate any stock.
Show data
| Period | x |
|---|---|
| Apple | 39.1 |
| Microsoft | 27.1 |
| Xiaomi | 20.4 |
| Alphabet | 15.3 |
| Samsung | 5.7 |
Source: Winus (winus.ai) financial data, retrieved Nov 12, 2026 (HKT); price-to-earnings on trailing four quarters, Nov 11, 2026 close
| Company | Share price | Trailing P/E | Trailing P/S | Price to book |
|---|---|---|---|---|
| Apple | US$355.63 | 39.1x | 10.8x | 46.1x |
| Microsoft | US$521.13 | 27.1x | 11.2x | 8.2x |
| Alphabet (Class A) | US$293.45 | 15.3x | 7.7x | 5.3x |
| Samsung Electronics | KRW 206,000 | 5.7x | 2.0x | Not in data |
| Xiaomi | HK$30.10 | 20.4x | 1.5x | 2.5x |
All as of the Nov 11, 2026 close, on four reported quarters to each company's latest report. Market caps tie to price times shares: Apple 14.53 bn shares at US$355.63, Microsoft 7.43 bn at US$521.13 and Xiaomi 25.80 bn at HK$30.10. Alphabet's 12.29 bn shares at US$293.45 is 0.4% above its returned market cap. Alphabet's 15.3x includes the US$112.2 bn quarter in Apr–Jun 2026; if that quarter had equalled Jul–Sep's US$26.5 bn, trailing net income would be US$150.0 bn and the multiple 24.0x. That is arithmetic, not a forecast. Samsung's 5.7x rests on four quarters that include Oct–Dec 2025, when net income was KRW 19.3 tn against KRW 75.2 tn in the latest quarter.
What to watch next for Apple and its competitors
Four numbers set the next comparison: Apple's Oct–Dec quarter against US$143.8 bn, Alphabet's Q4 against US$127.6 bn, Microsoft's Q2 FY2027 against US$92.3 bn, and Xiaomi's first Jul–Sep 2026 report against RMB 108.9 bn.
- Apple: Q1 FY2027 (Oct–Dec 2026), report date per Apple's SEC filings. Revenue against US$143.8 bn in the year-earlier quarter, its largest in the data, and gross margin against 48.2%. A year-on-year rate above 11.7% would be faster than Jul–Sep.
- Microsoft: Q2 FY2027 (Oct–Dec 2026), date per Microsoft's SEC filings. Revenue against US$81.3 bn in Oct–Dec 2025 and US$92.3 bn in Q1; gross margin against 67.8%.
- Alphabet: Q4 2026, date per Alphabet's SEC filings. Revenue against US$113.8 bn a year earlier and US$127.6 bn in Q3; net income against US$26.5 bn in Q3.
- Samsung Electronics and Xiaomi: dates per each company's own announcements. Samsung's Q4 against KRW 195.3 tn of revenue and KRW 75.2 tn of net income; Xiaomi's Q3 against RMB 113.1 bn in Jul–Sep 2025 and RMB 108.9 bn in Apr–Jun.
Not on this page: Apple unit shipments, revenue by region, Huawei's results, free cash flow, analyst consensus and company guidance. Those are in each company's quarterly release and filings.
How to compare Apple and its competitors yourself in Winus
Open Winus, type #AAPL, #MSFT, #GOOGL, #005930.KS and #1810.HK in one message and ask for a side-by-side of growth, margins and multiples. The Comparable Company Analysis skill can produce the comps as an Excel workbook you can keep, with written analysis; this page's tables are a snapshot of the same fields.

Start from Financial Chat, where answers come with citations, or type / to pick a skill. To see how Winus sits next to other research tools, read Koyfin alternatives.
Compare Apple and its rivals in WinusFree tier: new accounts start with 1,000 credits at sign-up.
About Winus. Winus (winus.ai) is a financial AI agent platform built on professional financial data and research expertise. Answers carry built-in citations, reusable skills run research workflows, and the output can be a report, an Excel model or a deck. To map the rivals of any company the way this page does for Apple, a financial AI agent such as Winus can build the comparable-company table and keep it as an Excel workbook.
Data sourced from Winus (winus.ai) financial data, which aggregates official data from global exchanges and trading partners. Figures as retrieved on Nov 12, 2026 (HKT); company filings govern if they differ. This page is for information only and is not investment advice.
FAQ
Who are Apple's main competitors?
Listed companies that overlap with Apple's phones, computers and services: Samsung Electronics, Alphabet, Microsoft and Xiaomi. At the Nov 11, 2026 close Apple was worth US$5,168.1 bn, against US$3,870.0 bn for Microsoft, US$3,591.9 bn for Alphabet, US$894.4 bn for Samsung and US$99.0 bn for Xiaomi.
Is Google a competitor of Apple?
Yes, in mobile platforms and subscriptions. Alphabet's subscriptions, platforms and devices line was US$48.0 bn, 11.9% of its 2025 revenue; Apple's Services revenue was US$109.2 bn, 26.2% of FY2025. Alphabet's Jul–Sep 2026 revenue grew 24.7% to US$127.6 bn, against 11.7% to US$114.5 bn for Apple.
Is Huawei a competitor of Apple?
In phones, yes, but Huawei is not a listed company and Winus financial data returned no result for it, so it is not in the tables on this page. Its results are in its own annual reports.
Where do the numbers on this page come from?
Revenue, gross margin, net income, market value and P/E are from Winus financial data, retrieved Nov 12, 2026 (HKT), with prices at the Nov 11, 2026 close. Each company's own filings govern if they differ.
What is Winus?
Winus is a financial AI agent platform built on professional financial data and research expertise. It combines specialized tools, reusable financial skills and coordinated AI agents so a natural-language request about a company, fund or market can produce research reports, Excel models and presentation decks. Type #AAPL in Winus to run this page's analysis yourself.