Tesla Competitors: 5 EV Rivals Compared on Data (2026)
Tesla's closest listed competitors by vehicle revenue are BYD, GM, Ford, Rivian and NIO. In Jul–Sep 2026 Tesla's revenue was US$28.0 bn, down 0.2% year on year, while BYD's rose 13.6% and Rivian's 38.3%. Tesla was worth US$1,544.9 bn at the Nov 11, 2026 close. This is a data page, not a recommendation.
Who are Tesla's competitors? Five listed rivals in one table
Five listed vehicle makers overlap with Tesla: BYD, GM, Ford, Rivian and NIO. At the Nov 11, 2026 close their combined market value was US$250.6 bn, against US$1,544.9 bn for Tesla alone, a ratio of 6.2.
| Company | Ticker | Market cap | Latest-quarter revenue | YoY | Gross margin | Overlap with Tesla |
|---|---|---|---|---|---|---|
| Tesla | TSLA | US$1,544.9 bn | US$28.0 bn (Jul–Sep 2026) | −0.2% | 19.6% | Vehicle sales 69.4% and energy storage 13.5% of FY2025 revenue |
| BYD | 1211.HK, 002594.SZ | US$98.8 bn | RMB 221.5 bn (Jul–Sep 2026) | +13.6% | 18.0% | Automobiles 80.7% of 2025 revenue; handset components and assembly 19.3% |
| GM | GM | US$75.0 bn | US$50.0 bn (Jul–Sep 2026) | +2.9% | 18.5% | Vehicle sales 90.8% of FY2025 revenue; GM Financial 9.2% |
| Ford | F | US$48.9 bn | US$49.5 bn (Jul–Sep 2026) | −2.0% | 14.9% | Vehicle sales 92.9% of FY2025 revenue; its Model e unit builds electric vehicles |
| Rivian | RIVN | US$19.8 bn | US$2.16 bn (Jul–Sep 2026) | +38.3% | 8.2% | US electric vehicle maker selling to consumers and commercial customers; segment split not used |
| NIO | NIO | US$8.1 bn | RMB 32.1 bn (Apr–Jun 2026) | +69.1% | 18.4% | Vehicle sales 87.9% of FY2025 revenue; battery swap and subscription services |
Source: Winus (winus.ai) financial data (official data aggregated from global exchanges and trading partners), retrieved Nov 12, 2026 (HKT). Market caps are at the Nov 11, 2026 close, the previous trading day; BYD's combines its Hong Kong and Shenzhen lines and is Winus financial data's US$ conversion. Revenue is in each company's reporting currency. NIO's Jul–Sep 2026 results are not in the data, so its row is Apr–Jun 2026. Company filings: Tesla, Ford, GM and Rivian on SEC EDGAR, NIO's annual reports on SEC EDGAR, BYD announcements on HKEXnews and CNInfo.
How the five were chosen: by overlap in vehicle revenue, not by market cap. Each is a listed company that makes and sells passenger or light commercial vehicles in markets where Tesla sells, and each reports vehicle sales as the bulk of its revenue. Xpeng and Li Auto also meet that rule and have their own pages, Xpeng stock and Li Auto stock; Toyota, Volkswagen and Mercedes-Benz are not in the table. Tesla's energy storage business, US$12.8 bn of FY2025 revenue, has no matching line in any of the five, so this page compares the vehicle side of Tesla. For a two-company view of Tesla and its largest China rival, see Tesla vs BYD.
Do Tesla and its competitors report on the same calendar and currency?
On the calendar, yes: all six report calendar quarters, so Jul–Sep 2026 is Q3 for each. On currency, no: BYD and NIO report in RMB, the other four in US$. NIO's Q3 is not yet in the data.
| Company | Fiscal year | Latest quarter used | Reports in | Share price in |
|---|---|---|---|---|
| Tesla | Calendar | Jul–Sep 2026 (Q3 FY2026) | US$ | US$ |
| Ford | Calendar | Jul–Sep 2026 (Q3 FY2026) | US$ | US$ |
| GM | Calendar | Jul–Sep 2026 (Q3 FY2026) | US$ | US$ |
| Rivian | Calendar | Jul–Sep 2026 (Q3 FY2026) | US$ | US$ |
| BYD | Calendar | Jul–Sep 2026 (Q3 2026) | RMB | HK$ (1211.HK), RMB (002594.SZ) |
| NIO | Calendar | Apr–Jun 2026 (Q2 2026) | RMB | US$ |
Growth rates and margins do not depend on the exchange rate, so those comparisons are direct. Size comparisons need a conversion; this page uses Winus financial data's own US$ conversions for BYD's and NIO's FY2025 revenue and for market caps, and the rate it applies is not stated in the data. Quarterly revenue for BYD and NIO stays in RMB. Where one company's period differs from the rest, the label says so.
Which Tesla competitor is growing fastest?
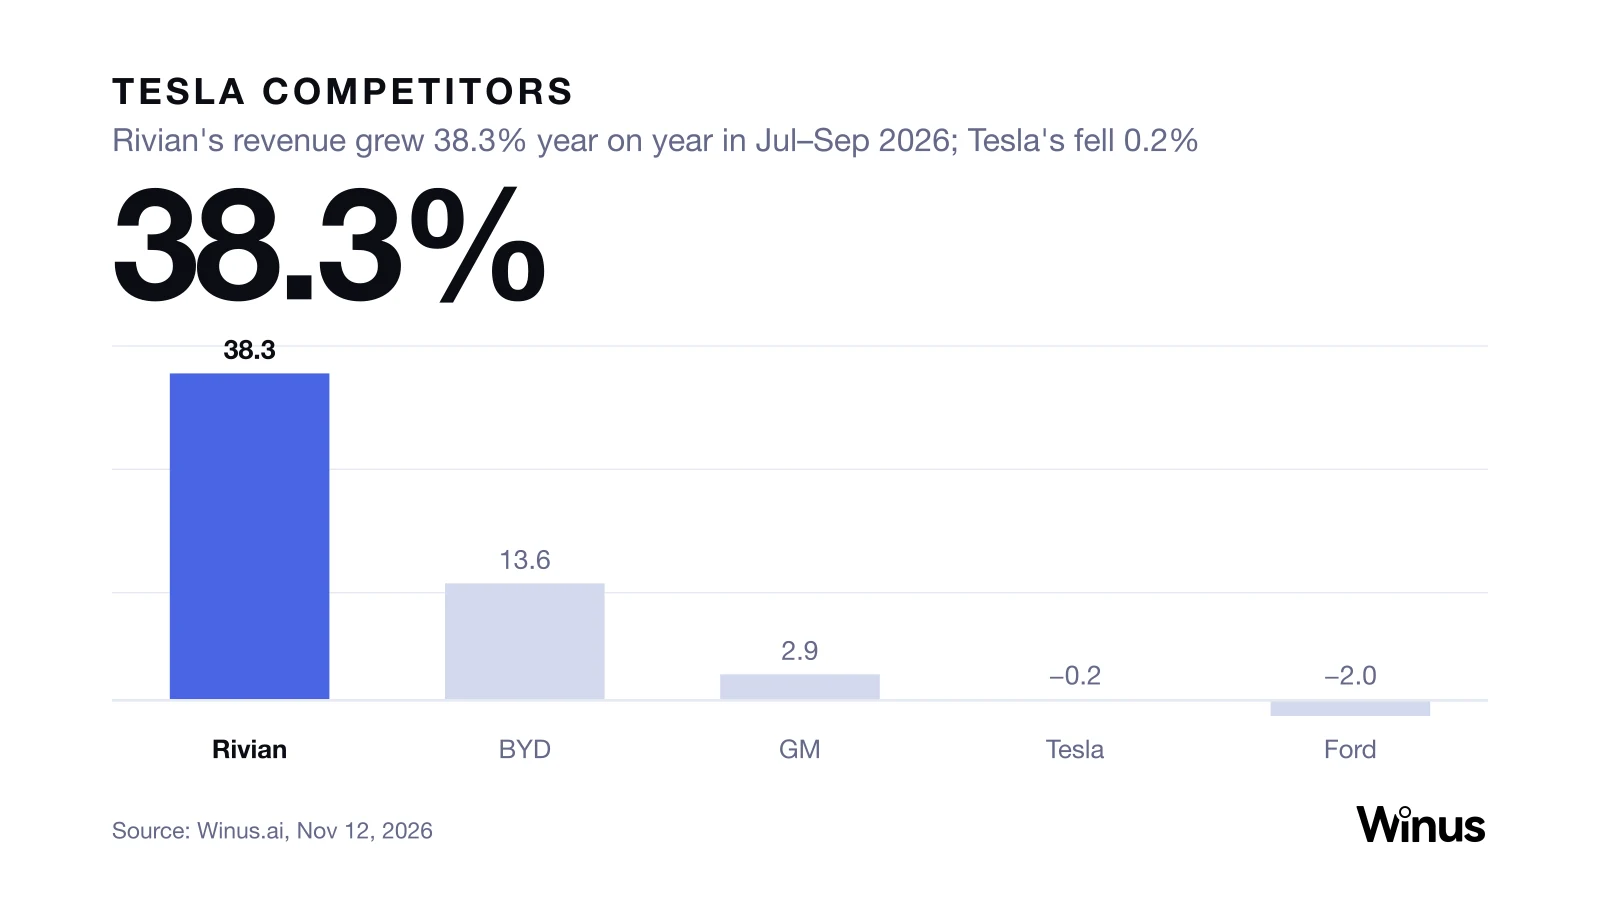
Rivian, among the five with Jul–Sep 2026 results: revenue rose 38.3% year on year to US$2.16 bn, against 13.6% for BYD, 2.9% for GM, −0.2% for Tesla and −2.0% for Ford. NIO grew 69.1% in Apr–Jun.
Show data
| Period | % | Note |
|---|---|---|
| Rivian | 38.3 | |
| BYD | 13.6 | |
| GM | 2.9 | |
| Tesla | -0.2 | US$28.0 bn |
| Ford | -2.0 |
Source: Winus (winus.ai) financial data, retrieved Nov 12, 2026 (HKT); GAAP revenue, Jul–Sep 2026 against Jul–Sep 2025; NIO's Q3 is not yet in the data
Revenue growth over the last four calendar quarters, each against the same quarter a year earlier:
| Quarter | Tesla | BYD | GM | Ford | Rivian | NIO |
|---|---|---|---|---|---|---|
| Oct–Dec 2025 | −3.1% | −13.5% | −5.1% | −4.8% | −25.8% | +75.9% |
| Jan–Mar 2026 | +15.8% | −11.8% | −0.9% | +6.4% | +11.4% | +112.2% |
| Apr–Jun 2026 | +25.5% | −3.2% | +1.9% | −3.8% | +27.2% | +69.1% |
| Jul–Sep 2026 | −0.2% | +13.6% | +2.9% | −2.0% | +38.3% | Not in data |
Three things the table says on its own:
- Tesla grew faster than Ford, GM and BYD in each of the first two quarters of 2026, then stalled. Its Jan–Sep 2026 revenue is up 12.5% (US$78.7 bn against US$69.9 bn); Ford's is down 0.2%, GM's up 1.4% and BYD's flat at 0.0%.
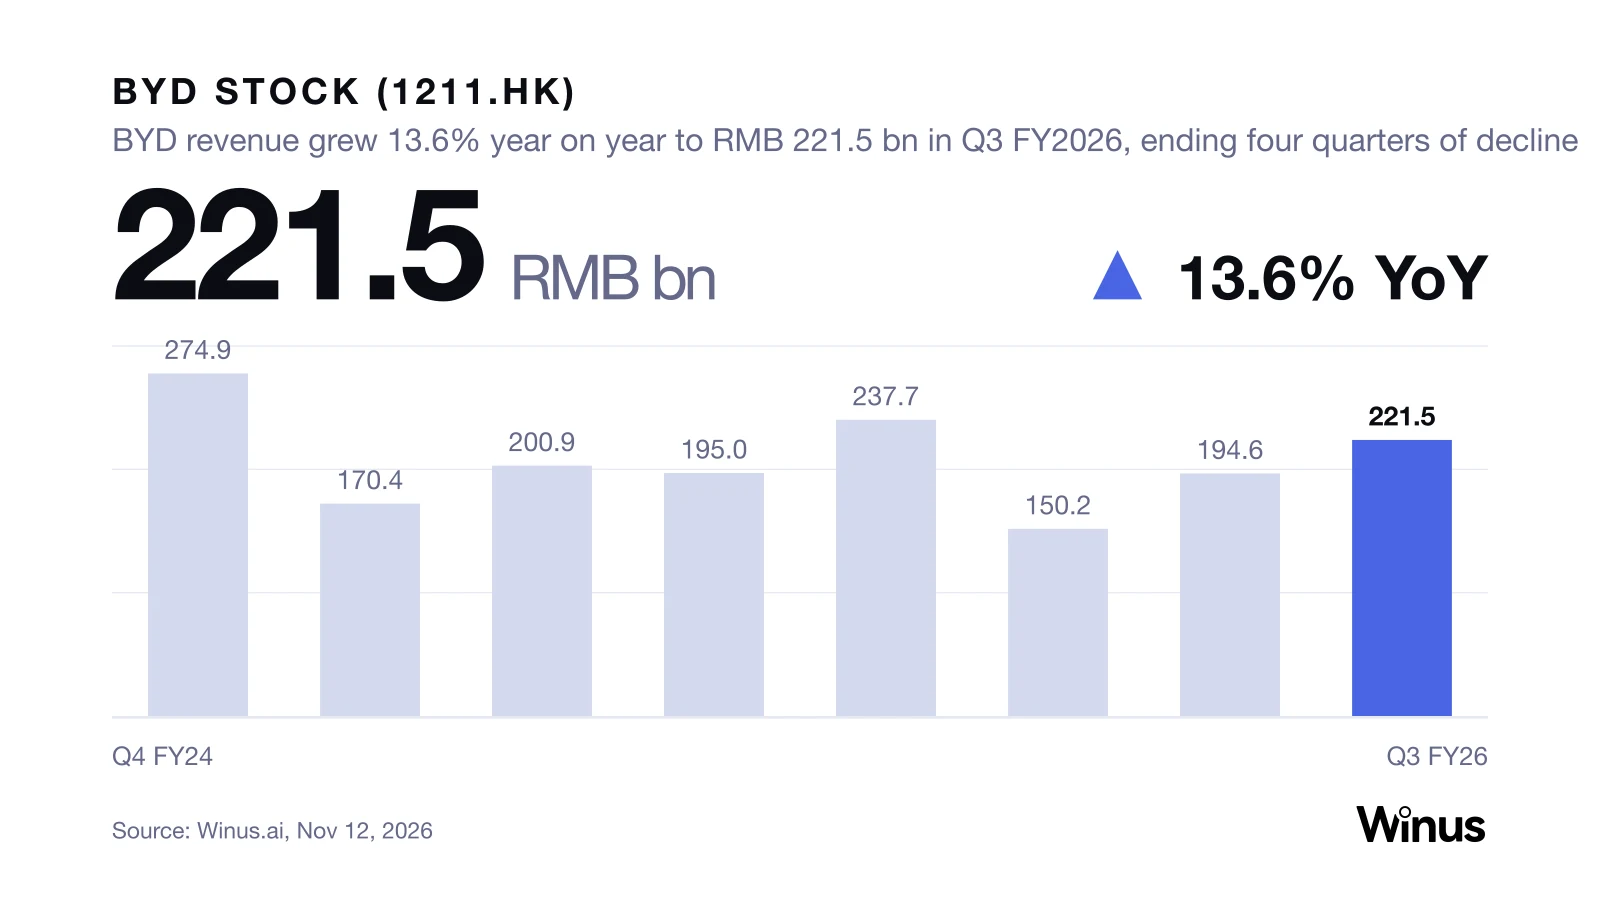
- BYD went from −13.5% to +13.6% in four quarters. Its Jul–Sep 2026 revenue of RMB 221.5 bn is the first quarterly increase since Apr–Jun 2025.
- Rivian and NIO grow fast from small bases. Rivian's nine-month revenue is US$5.2 bn, up 26.7%; NIO's first half is RMB 57.7 bn, up 85.8%.
Which Tesla competitor has the highest gross margin?
Tesla, at 19.6% in Jul–Sep 2026. Among its rivals GM is highest at 18.5%, followed by NIO at 18.4% (Apr–Jun), BYD at 18.0%, Ford at 14.9% and Rivian at 8.2%.
Show data
| Period | % | Note |
|---|---|---|
| Tesla | 19.6 | |
| GM | 18.5 | |
| NIO | 18.4 | Apr–Jun 2026 |
| BYD | 18.0 | |
| Ford | 14.9 | |
| Rivian | 8.2 |
Source: Winus (winus.ai) financial data, retrieved Nov 12, 2026 (HKT); GAAP gross margin, Jul–Sep 2026 except NIO (Apr–Jun 2026)
The five rivals sit between 8.2% and 18.5%, so the spread to Tesla is 1.1 points at the closest and 11.4 points at the widest. Compared with a year earlier, every company is higher: Rivian by 6.6 points (from 1.5% to 8.2%), NIO by 8.4 points (from 10.0% to 18.4%), GM by 4.9 points (from 13.7% to 18.5%), Tesla by 1.6, Ford by 0.8 and BYD by 0.4. Tesla's margin has stayed between 16.8% and 21.1% over the last four quarters; GM's low of 5.7% and Ford's of −12.5% are both Oct–Dec 2025. Segment margins, which would show what vehicles earn apart from energy, finance and services, are not on this page.
Which Tesla competitor is the most profitable? Net income and net margin
GM, in Jul–Sep 2026: US$3.33 bn of net income on a 6.7% margin, 4.2 times Tesla's US$0.79 bn. BYD earned RMB 10.0 bn (4.5%), Ford US$2.05 bn (4.1%) and Tesla 2.8%. Rivian and NIO reported losses.
| Company | Net income, latest quarter | Net margin | Net income, FY2025 | FY2025 net margin |
|---|---|---|---|---|
| Tesla | US$0.79 bn | 2.8% | US$3.79 bn | 4.0% |
| GM | US$3.33 bn | 6.7% | US$2.70 bn | 1.5% |
| BYD | RMB 10.0 bn | 4.5% | RMB 32.6 bn (US$4.64 bn) | 4.1% |
| Ford | US$2.05 bn | 4.1% | −US$8.18 bn | −4.4% |
| Rivian | −US$0.91 bn | −42.4% | −US$3.65 bn | −67.7% |
| NIO | −RMB 0.72 bn (Apr–Jun) | −2.2% | −RMB 15.6 bn (−US$2.22 bn) | −17.8% |
Net income is attributable to shareholders. Quarterly figures are Jul–Sep 2026 except NIO. US$ amounts in brackets are Winus financial data's conversions.
- Tesla and BYD were profitable in every one of the last 11 quarters in the data. Ford and GM each had a loss quarter in the period, Rivian lost money in all 11, and NIO's only profit in 10 quarters was RMB 0.12 bn in Oct–Dec 2025.
- Ford's FY2025 loss comes from one quarter. Oct–Dec 2025 was a loss of US$11.06 bn; the other three quarters of 2025 add up to a profit of US$2.88 bn. GM's Oct–Dec 2025 quarter was a loss of US$3.31 bn.
- Over the last four quarters Tesla earned US$3.22 bn on US$103.6 bn of revenue (3.1%) and GM US$3.96 bn on US$187.0 bn (2.1%). Ford's four quarters add up to a loss of US$7.79 bn.
How big is Tesla next to its competitors? Revenue and market value
Ford and GM each have about twice Tesla's revenue: US$187.3 bn and US$185.0 bn in FY2025, against US$94.8 bn. Tesla's market value is 31.6 times Ford's and 20.6 times GM's.
Show data
| Period | USD bn | Note |
|---|---|---|
| Ford | 187.3 | |
| GM | 185.0 | |
| BYD | 114.4 | RMB 804.0 bn |
| Tesla | 94.8 | |
| NIO | 12.5 | RMB 87.5 bn |
| Rivian | 5.4 |
Source: Winus (winus.ai) financial data, retrieved Nov 12, 2026 (HKT); FY2025 revenue as reported; BYD and NIO converted to US$ by Winus financial data
| Company | FY2025 revenue | vs FY2024 | Market cap, Nov 11, 2026 | Tesla's market cap as a multiple |
|---|---|---|---|---|
| Tesla | US$94.8 bn | −2.9% | US$1,544.9 bn | 1.0x |
| BYD | RMB 804.0 bn (US$114.4 bn) | +3.5% | US$98.8 bn | 15.6x |
| GM | US$185.0 bn | −1.3% | US$75.0 bn | 20.6x |
| Ford | US$187.3 bn | +1.2% | US$48.9 bn | 31.6x |
| Rivian | US$5.4 bn | +8.4% | US$19.8 bn | 78.2x |
| NIO | RMB 87.5 bn (US$12.5 bn) | +33.1% | US$8.1 bn | 190.8x |
Tesla's FY2025 revenue fell 2.9%, the largest decline in the table; GM's fell 1.3% and Ford's rose 1.2%. BYD's FY2024 revenue is the sum of its four 2024 quarters (RMB 777.1 bn). The data pulled for this page does not carry vehicle deliveries, so unit volumes are in each company's own release.
Is Tesla more expensive than its competitors? P/S, P/E and market cap
Tesla, by a wide margin: 14.9 times trailing sales and 480.1 times trailing earnings, against 0.3 to 3.0 times sales for the five rivals. This page reports the multiples and does not rate any of the stocks.
Show data
| Period | x |
|---|---|
| Tesla | 14.9 |
| Rivian | 3.0 |
| BYD (002594.SZ) | 0.9 |
| NIO | 0.5 |
| GM | 0.4 |
| Ford | 0.3 |
Source: Winus (winus.ai) financial data, retrieved Nov 12, 2026 (HKT); price-to-sales on trailing four quarters, Nov 11, 2026 close
| Company | Share price | Trailing P/E | Trailing P/S | Price to book |
|---|---|---|---|---|
| Tesla | US$390.84 | 480.1x | 14.9x | 17.3x |
| BYD | HK$69.20; RMB 82.04 | 17.3x (1211.HK); 23.6x (002594.SZ) | 0.7x (1211.HK); 0.9x (002594.SZ) | 2.2x; 3.0x |
| GM | US$88.90 | 19.3x | 0.4x | 1.2x |
| Ford | US$12.25 | Not meaningful | 0.3x | 1.3x |
| Rivian | US$13.54 | Not meaningful | 3.0x | 3.5x |
| NIO | US$3.24 | Not meaningful | 0.5x | 13.5x |
All as of the Nov 11, 2026 close, on the four reported quarters to each company's latest report (NIO's end in Jun 2026). "Not meaningful" means trailing net income is negative. Tesla's 480.1x is its US$1,544.9 bn market cap over US$3.22 bn of trailing net income; its US$ market cap equals 3.95 bn shares at US$390.84. The same check holds for Ford (3.99 bn shares at US$12.25), GM (0.84 bn at US$88.90) and Rivian (1.46 bn at US$13.54). GM's 19.3x is the multiple as Winus financial data returns it; US$75.0 bn over its four-quarter net income of US$3.96 bn gives 19.0x. BYD's two lines apply each listing's price to the whole share count.
What to watch next for Tesla and its competitors
Four numbers set the next comparison: Tesla's Q4 revenue against US$24.9 bn, Ford's and GM's Q4 results against their Oct–Dec 2025 losses, BYD's Q4 against RMB 237.7 bn, and NIO's first Jul–Sep 2026 report.
- Tesla: Q4 FY2026 report, date per Tesla's investor relations. Revenue against US$24.9 bn in Oct–Dec 2025 and US$28.0 bn in Q3; gross margin against 20.1% a year earlier and 19.6% in Q3. Nine-month revenue of US$78.7 bn is already 83.0% of FY2025's US$94.8 bn.
- Ford and GM: Q4 FY2026 reports, dates per each company's filings. Ford against a Q4 FY2025 loss of US$11.06 bn and gross margin of −12.5%; GM against a loss of US$3.31 bn and gross margin of 5.7%. Both compare with revenue of US$45.9 bn and US$45.3 bn a year earlier.
- BYD: Q4 2026 and full-year results, dates per BYD announcements on HKEXnews or CNInfo. Revenue against RMB 237.7 bn in Oct–Dec 2025 and gross margin against 17.4%. Nine-month revenue is RMB 566.3 bn, level with 2025.
- NIO: Jul–Sep 2026 report, date per NIO's announcements. Revenue against RMB 32.1 bn in Apr–Jun and RMB 21.8 bn in Jul–Sep 2025; gross margin against 18.4%. Rivian's Q4 against US$1.29 bn and 9.3%.
For the US macro calendar, see the weekly macro page.
Not on this page: vehicle deliveries, revenue by region, free cash flow, analyst consensus, company guidance and Rivian's segment split. Those are in each company's quarterly release and filings. Companies outside the selection rule, including Toyota, Volkswagen and Mercedes-Benz, are not covered here; for single-company data see NIO stock and BYD stock.
How to compare Tesla and its competitors yourself in Winus
Open Winus, type #TSLA, #F, #GM, #RIVN, #NIO and #1211.HK in one message and ask for a side-by-side of growth, margins and multiples. The Comparable Company Analysis skill can produce the comps as an Excel workbook you can keep, with written analysis; this page's tables are a snapshot of the same fields.

Start from Financial Chat, where answers come with citations, or type / to pick a skill. To see how Winus sits next to other research tools, read Koyfin alternatives.
Compare Tesla and its rivals in WinusFree tier: new accounts start with 1,000 credits at sign-up.
About Winus. Winus (winus.ai) is a financial AI agent platform built on professional financial data and research expertise. Answers carry built-in citations, reusable skills run research workflows, and the output can be a report, an Excel model or a deck. To refresh this rival table after the next earnings, Winus can rerun the comparable-company analysis and return an updated workbook.
Data sourced from Winus (winus.ai) financial data, which aggregates official data from global exchanges and trading partners. Figures as retrieved on Nov 12, 2026 (HKT); company filings govern if they differ. This page is for information only and is not investment advice.
FAQ
Who are Tesla's main competitors?
Listed vehicle makers whose revenue overlaps with Tesla's: BYD, GM, Ford, Rivian and NIO. By FY2025 revenue Ford (US$187.3 bn) and GM (US$185.0 bn) are about twice Tesla's US$94.8 bn; by market value Tesla, at US$1,544.9 bn on Nov 11, 2026, is 6.2 times the five combined.
Is Rivian a competitor of Tesla?
Yes, as a listed US electric vehicle maker. Rivian's revenue was US$2.16 bn in Jul–Sep 2026, up 38.3% year on year, against US$28.0 bn for Tesla, down 0.2%. Rivian reported a net loss of US$0.91 bn in the quarter; Tesla earned US$0.79 bn.
Which Tesla competitor is growing fastest?
In Jul–Sep 2026, Rivian: revenue rose 38.3% to US$2.16 bn, then BYD at 13.6%, GM at 2.9%, Tesla at −0.2% and Ford at −2.0%. NIO's latest quarter in the data is Apr–Jun 2026, when its revenue rose 69.1% to RMB 32.1 bn.
Where do the numbers on this page come from?
Revenue, gross margin, net income, market value and P/E are from Winus financial data, retrieved Nov 12, 2026 (HKT), with prices at the Nov 11, 2026 close. Each company's own filings govern if they differ.
What is Winus?
Winus is a financial AI agent platform built on professional financial data and research expertise. It combines specialized tools, reusable financial skills and coordinated AI agents so a natural-language request about a company, fund or market can produce research reports, Excel models and presentation decks. Type #TSLA in Winus to run this page's analysis yourself.